Page 127 - IJPS-10-2
P. 127

International Journal of
            Population Studies                                                          Child malnutrition in rural India


            had completed secondary or higher education. Regarding   3.2. Differentials in child malnutrition by
            the household characteristics, the general caste category   background characteristics
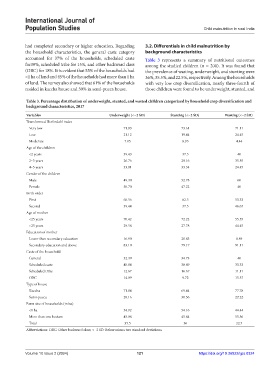
            accounted for 37% of the households, scheduled caste   Table 3 represents a summary of nutritional outcomes
            for30%, scheduled tribe for 15%, and other backward class   among the studied children (n = 200). It was found that
            (OBC) for 18%. It is evident that 55% of the households had   the prevalence of wasting, underweight, and stunting were
            <1 ha of land and 45% of the households had more than 1 ha   36%, 35.5%, and 22.5%, respectively. Among the households
            of land. The survey also showed that 61% of the households   with very low crop diversification, nearly three-fourth of
            resided in kaccha house and 39% in semi-pucca house.  those children were found to be underweight, stunted, and

            Table 3. Percentage distribution of underweight, stunted, and wasted children categorized by household crop diversification and
            background characteristics, 2017
            Variables                           Underweight (<−2 SD)      Stunting (<−2 SD)      Wasting (<−2 SD)
            Transformed Herfindahl index
             Very low                                 71.83                   73.61                  71.11
             Low                                      21.12                   19.44                  24.45
             Moderate                                 7.05                     6.95                  4.44
            Age of the children
             <2 years                                 39.43                    37.5                   40
             2–3 years                                26.76                   29.16                  35.55
             4–5 years                                33.81                   33.34                  24.45
            Gender of the children
             Male                                     49.30                   52.78                   60
             Female                                   50.70                   47.22                   40
            Birth order
             First                                    60.56                    62.5                  53.33
             Second                                   39.44                    37.5                  46.67
            Age of mother
             <25 years                                70.42                   72.22                  55.55
             >25 years                                29.58                   27.78                  44.45
            Education of mother
             Lower than secondary education           16.90                   20.83                  8.89
             Secondary education and above            83.10                   79.17                  91.11
            Caste of the household
             General                                  32.39                   34.73                   40
             Scheduled caste                          40.84                   38.89                  33.33
             Scheduled tribe                          12.67                   16.67                  11.11
             OBC                                      14.09                    9.72                  15.57
            Type of house
             Kaccha                                   71.84                   69.44                  77.78
             Semi-pucca                               28.16                   30.56                  22.22
            Farm size of households (in ha)
             <1 ha                                    54.92                   54.16                  44.44
             More than one hectare                    45.08                   45.84                  55.56
             Total                                    35.5                     36                    22.5
            Abbreviations: OBC: Other backward class; <−2 SD: Below minus two standard deviations.


            Volume 10 Issue 2 (2024)                       121                        https://doi.org/10.36922/ijps.0324
   122   123   124   125   126   127   128   129   130   131   132