
Page 31 - IJPS-10-3
P. 31
International Journal of
Population Studies Prenatal care in Santa Catarina, Brazil
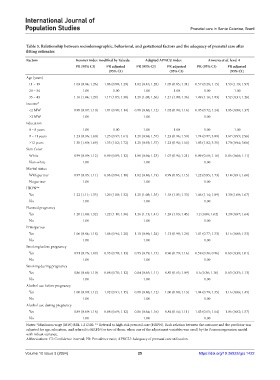
Table 5. Relationship between sociodemographic, behavioral, and gestational factors and the adequacy of prenatal care after
fitting estimates
Factors Kessner index modified by Takeda Adapted APNCU index Anversa et al. level 4
PR (95% CI) PR adjusted PR (95% CI) PR adjusted PR (95% CI) PR adjusted
(95% CI) (95% CI) (95% CI)
Age (years)
11 – 19 1.03 (0.84; 1.26) 1.06 (0.88; 1.29) 1.02 (0.81; 1.28) 1.05 (0.85; 1.31) 0.57 (0.28; 1.15) 1.53 (1.18; 1.97)
20 – 34 1.00 1.00 1.00 1.00 1.00 1.00
35 – 43 1.16 (1.04; 1.29) 1.17 (1.05; 1.30) 1.21 (1.08; 1.36) 1.21 (1.08; 1.36) 1.49 (1.16; 1.93) 1.52 (0.31; 1.26)
Income*
<2 MW 0.98 (0.87; 1.10) 1.01 (0.90; 1.14) 0.98 (0.86; 1.12) 1.02 (0.90; 1.16) 0.95 (0.72; 1.24) 1.05 (0.80; 1.37)
≥2 MW 1.00 1.00 1.00
Education
0 – 8 years 1.00 1.00 1.00 1.00 1.00 1.00
9 – 11 years 1.23 (0.96; 1.60) 1.25 (0.97; 1.61) 1.21 (0.94; 1.57) 1.23 (0.96; 1.59) 1.74 (0.97; 3.09) 1.67 (0.95; 2.96)
≥12 years 1.30 (1.00; 1.69) 1.33 (1.02; 1.72) 1.21 (0.93; 1.57) 1.23 (0.94; 1.60) 1.83 (1.02; 3.31) 1.70 (0.94; 3.06)
Skin Color
White 0.99 (0.89; 1.12) 0.99 (0.89; 1.12) 1.08 (0.94; 1.23) 1.07 (0.94; 1.21) 0.89 (0.68; 1.16) 0.86 (0.66; 1.11)
Non-white 1.00 1.00 1.00
Marital status
With partner 0.97 (0.85; 1.11) 0.96 (0.84; 1.10) 1.02 (0.86; 1.19) 0.99 (0.85; 1.15) 1.22 (0.85; 1.73) 1.14 (0.81; 1.60)
No partner 1.00 1.00 1.00
HRPN**
Yes 1.22 (1.11; 1.35) 1.20 (1.08; 1.32) 1.21 (1.08; 1.35) 1.18 (1.05; 1.33) 1.46 (1.14; 1.89) 1.30 (1.00; 1.67)
No 1.00 1.00 1.00
Planned pregnancy
Yes 1.20 (1.08; 1.32) 1.22 (1.10; 1.36) 1.26 (1.13; 1.41) 1.28 (1.13; 1.45) 1.2 (0.88; 1.62) 1.20 (0.87; 1.64)
No 1.00 1.00 1.00
Primiparous
Yes 1.06 (0.94; 1.18) 1.06 (0.94; 1.20) 1.10 (0.96; 1.24) 1.13 (0.98; 1.28) 1.01 (0.77; 1.33) 1.16 (0.88; 1.53)
No 1.00 1.00 1.00
Smoking before pregnancy
Yes 0.91 (0.76; 1.09) 0.93 (0.78; 1.13) 0.95 (0.79; 1.15) 0.96 (0.79; 1.16) 0.59 (0.36; 0.96) 0.63 (0.39; 1.01)
No 1.00 1.00 1.00
Smoking during pregnancy
Yes 0.86 (0.68; 1.10) 0.88 (0.70; 1.12) 0.84 (0.65; 1.11) 0.85 (0.65; 1.09) 0.6 (0.36; 1.10) 0.63 (0.35; 1.13)
No 1.00 1.00 1.00
Alcohol use before pregnancy
Yes 1.00 (0.89; 1.12) 1.92 (0.91; 1.15) 0.98 (0.86; 1.12) 1.00 (0.88; 1.13) 1.04 (0.79; 1.35) 1.16 (0.86; 1.45)
No 1.00 1.00 1.00
Alcohol use during pregnancy
Yes 0.89 (0.69; 1.16) 0.88 (0.69; 1.12) 0.86 (0.64; 1.16) 0.84 (0.64; 1.11) 1.03 (0.65; 1.64) 1.06 (0.82; 1.57)
No 1.00 1.00 1.00
Notes: *Minimum wage (MW) BRL 1,212.00. ** Referral to high-risk prenatal care (HRPN). Each relation between the outcome and the predictor was
adjusted for age, education, and referral to HRPN (or two of them, when one of the adjustment variables was used) by the Poisson regression model
with robust variance.
Abbreviations: CI: Confidence interval; PR: Prevalence ratio; APNCU: Adequacy of prenatal care utilization.
Volume 10 Issue 3 (2024) 25 https://doi.org/10.36922/ijps.1422