Page 87 - IJPS-10-3
P. 87

International Journal of
            Population Studies                                              Pandemic spurs interstate outmigration in India


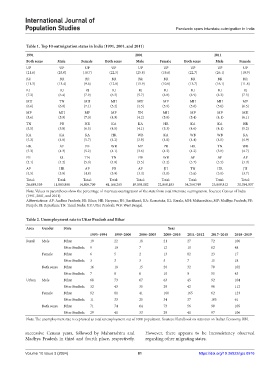
            Table 1. Top 10 outmigration states in India (1991, 2001, and 2011)
            1991                                           2001                             2011
            Both sexes   Male       Female    Both sexes   Male      Female    Both sexes    Male      Female
            UP            UP         UP         UP          UP         UP         UP          UP        UP
            (21.6)       (25.0)     (18.7)      (22.5)     (25.8)     (19.6)     (22.7)      (26.1)     (19.9)
            BR            BR         BR          BR         BR         BR         BR          BR        BR
            (11.3)       (13.4)      (9.6)      (12.8)     (15.9)     (10.0)     (13.7)      (16.1)     (11.8)
            RJ             RJ        RJ          RJ         RJ         RJ         RJ          RJ         RJ
            (7.3)         (6.4)      (7.9)      (6.3)      (5.7)      (6.8)       (6.9)      (6.3)      (7.3)
            MH            TN         MH         MH         MH         MP          MH         MH         MP
            (6.6)         (6.0)      (7.1)      (5.2)      (4.5)      (5.9)       (5.6)      (5.0)      (6.5)
            MP            MH         MP         MP          TN        MH          MP         MP         MH
            (5.6)         (5.9)      (7.0)      (4.9)      (4.2)      (5.8)       (5.4)      (4.1)      (6.1)
            TN            PB         HR         KA          KA        HR          KA         KA         HR
            (5.5)         (5.0)      (6.5)      (4.5)      (4.1)      (5.3)       (4.6)      (4.1)      (5.2)
            KA            KA         KA         HR          WB         KA         WB         WB         KA
            (5.3)         (4.8)      (5.7)      (4.2)      (3.9)      (4.8)       (4.4)      (4.0)      (4.9)
            HR            AP         PB         WB          MP         PB         HR         TN         WB
            (5.3)         (4.3)      (5.2)      (4.1)      (3.6)      (4.3)       (4.2)      (3.8)      (4.7)
            PB            KL         TN         TN          PB        WB          AP          AP        AP
            (5.1)         (4.2)      (5.0)      (4.0)      (3.5)      (4.2)       (3.7)      (3.5)      (3.9)
            AP            HR         AP          PB         AP         JH         TN         HR          JH
            (4.5)         (3.8)      (4.8)      (3.9)      (3.4)      (4.0)       (3.6)      (3.0)      (3.7)
            Total:        Total:    Total:      Total:     Total:     Total:     Total:      Total:     Total:
            26,689,595  11,883,886  14,805,709  41,166,265  19,098,082  22,068,183  54,264,749  23,869,812  30,394,937
            Note: Values in parentheses show the percentage of interstate outmigration of the state from total interstate outmigration. Sources: Census of India
            (1991, 2001, and 2011).
            Abbreviations: AP: Andhra Pradesh; BR: Bihar; HR: Haryana; JH: Jharkhand; KA: Karnataka; KL: Kerala; MH: Maharashtra; MP: Madhya Pradesh; PB:
            Punjab; RJ: Rajasthan; TN: Tamil Nadu; UP: Uttar Pradesh; WB: West Bengal.


            Table 2. Unemployment rate in Uttar Pradesh and Bihar
            Area   Gender   State                                       Year
                                       1993–1994  1999–2000  2004–2005  2009–2010  2011–2012  2017–2018  2018–2019
            Rural  Male     Bihar      19         22        18         21        27        72        106
                            Uttar Pradesh  9      10        7          12        10        62        48
                   Female   Bihar      6          5         2          13        82        23        17
                            Uttar Pradesh  3      3         3          5         7         15        18
                   Both sexes  Bihar   16         18        15         20        32        70        102
                            Uttar Pradesh  7      8         6          10        9         55        43
            Urban  Male     Bihar      68         73        67         63        45        92        104
                            Uttar Pradesh  32     43        35         29        42        96        112
                   Female   Bihar      92         81        41         160       165       62        123
                            Uttar Pradesh  11     33        25         34        37        105       61
                   Both sexes  Bihar   71         74        64         73        56        90        105
                            Uttar Pradesh  29     41        33         29        41        97        106
            Note: The unemployment rate is expressed as total unemployment out of 1000 population. Sources: Handbook on statistics on Indian Economy, RBI.


            successive Census years, followed by Maharashtra and   However, there appears to be inconsistency observed
            Madhya Pradesh in third and fourth place, respectively.   regarding other migrating states.


            Volume 10 Issue 3 (2024)                        81                        https://doi.org/10.36922/ijps.0916
   82   83   84   85   86   87   88   89   90   91   92