
Page 89 - IJPS-10-3
P. 89
International Journal of
Population Studies Pandemic spurs interstate outmigration in India
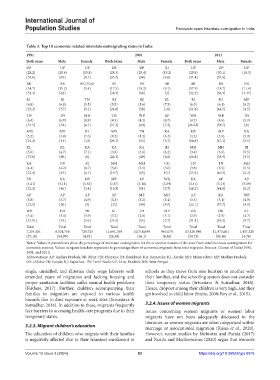
Table 3. Top 10 economic‑related interstate outmigrating states in India
1991 2001 2011
Both sexes Male Female Both Sexes Male Female Both sexes Male Female
UP UP UP UP UP RJ UP UP UP
(28.2) (29.6) (15.8) (28.3) (29.4) (15.2) (28.8) (30.1) (18.5)
[35.6] [65] [4.1] [35.7] [64] [9.6] [31.4] [57.6]
BR BR BR (10.6) BR BR BR BR BR BR
(14.7) (15.2) [5.4] (17.5) (18.2) (9.1) (17.9) (18.7) (11.4)
[35.4] [62] [38.7] [64] [2] [32.3] [58.3] [4.47]
RJ RJ TN RJ RJ KL RJ RJ MP
(6.8) (6.8) (9.5) (5.5) (5.6) (7.5) (6.0) (6.1) (6.2)
[25.2] [57] [9.2] [24.8] [54] [14] [21.6] [48.5] [4.5]
TN TN MH TN WB AP WB WB TN
(6.4) (6.0) (8.9) (4.5) (4.2) (6.7) (4.7) (4.6) (5.9)
[31.5] [54] [6.1] [31.3] [60] [7.2] [26.22] [58.5] [8]
MH MH KL WB TN KA MP MP KA
(5.2) (4.8) (7.6) (4.2) (4.2) (6.4) (4.2) (3.9) (5.9)
[21.2] [44] [12] [29.1] [55] [5.7] [18.8] [47.1] [5.5]
KL KL KA KA KA JH MH MH RJ
(5.0) (4.7) (7.1) (3.9) (3.6) (6.2) (3.8) (3.6) (5.5)
[37.6] [60] [6] [24.3] [49] [6.6] [16.8] [35.9] [3.5]
KA PB RJ MH MH CG TN TN MH
(4.4) (4.2) (6.7) (3.6) (3.5) (5.6) (3.8) (3.5) (5.5)
[22.4] [45] [4.1] [19.7] [43] 10.3 [25.8] [46.5] [4.2]
PB KA MP MP AP WB KA AP AP
(4.21) (4.11) (5.53) (3.37) (3.18) (5.59) (3.41) (3.13) (5.19)
[22.2] [46] [3.8] [19.5] [51] [5.7] [18.2] [44.8] [6.2]
AP AP AP AP MP MH AP KA WB
(3.8) (3.7) (4.9) (3.3) (3.2) (5.4) (3.3) (3.1) (4.9)
[22.5] [50] [5] [25] [49] [4.0] [22.1] [37.7] [4.9]
WB HR PB KL JH MP OR OR KL
(3.4) (3.4) (3.9) (3.2) (2.9) (5.1) (2.9) (2.9) (4.7)
[21.91] [49] [3.6] [35.4] [55] [3.7] [31.4] [59.2] [9.7]
Total Total Total Total Total Total Total Total Total
7,254,481 6,524,756 729,725 11,681,769 10,718,699 963,070 13,420,989 11,973,661 1,447,328
[27.18] [54.90] [4.93] [28.38] [56.1] [4.36] [24.73] [50.16] [4.76]
Notes: Values in parentheses show the percentage of interstate outmigration for the economic reasons of the state from total interstate outmigration for
economic reasons. Values in square brackets represent the percentage share of economic migrants from total migrants. Sources: Census of India (1991,
2001, and 2011).
Abbreviations: AP: Andhra Pradesh; BR: Bihar; HR: Haryana; JH: Jharkhand; KA: Karnataka; KL: Kerala; MH: Maharashtra; MP: Madhya Pradesh;
OR: Odisha: PB: Punjab; RJ: Rajasthan; TN: Tamil Nadu; UP: Uttar Pradesh; WB: West Bengal.
single, unskilled, and illiterate daily wage laborers with schools as they move from one location to another with
extended years of migration and lacking housing and their families, and the schooling system does not consider
proper sanitation facilities suffer mental health problems their temporary status (Srivastava & Sutradhar, 2016).
(Firdaus, 2017). Further, children accompanying their Hence, dropout among their children is very high, and they
families in migration are exposed to various health get involved in child labor (Smita, 2008; Roy et al., 2015).
hazards due to dust exposure at work sites (Srivastava &
Sutradhar, 2016). In addition to these, migrants frequently 3.2.4. Issues of women migrants
face barriers to accessing health-care programs due to their Issues concerning women migrants or women labor
temporary status. migrants have not been adequately discussed in the
literature, as women migrants are often categorized within
3.2.3. Migrant children’s education marriage or associational migration (Rajan et al., 2020).
The education of children who migrate with their families However, recent studies by Mehrotra and Parida (2017)
is negatively affected due to their transient enrollment in and Parida and Madheswaran (2020) argue that women’s
Volume 10 Issue 3 (2024) 83 https://doi.org/10.36922/ijps.0916