
Page 126 - IJPS-10-4
P. 126
International Journal of
Population Studies Gender disparities in pandemic telehealth use
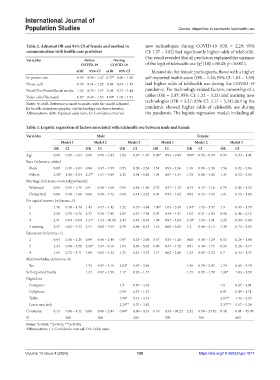
Table 2. Adjusted OR and 95% CI of female and method in new technologies during COVID-19 (OR = 2.29; 95%
communication with health‑care providers CI: 1.37 – 3.82) had significantly higher odds of telehealth.
Our result revealed that all predictors explained the variance
Variables Before During
2
COVID‑19 COVID‑19 of the logit of telehealth use (χ [18] = 60.45; p < 0.001).
aOR 95% CI aOR 95% CI Meanwhile, for female participants, those with a higher
In-person visit 0.93 0.58 – 1.47 0.77* 0.60 – 1.00 self-reported health score (OR = 1.28; 95% CI: 1.03 – 1.59)
Phone calls 0.95 0.74 – 1.22 0.88 0.67 – 1.15 had higher odds of telehealth use during the COVID-19
Email/Text/Portal/Social media 1.12 0.79 – 1.57 1.05 0.77 – 1.44 pandemic. For technology-related factors, ownership of a
Video calls/Telehealth 0.87 0.49 – 1.55 1.40* 1.02 – 1.91 tablet (OR = 2.07; 95% CI: 1.32 – 3.23) and learning new
Notes: *p<0.05. Reference is made to males, with the model adjusted technologies (OR = 3.37; 95% CI: 2.17 – 5.24) during the
for health, sociodemographic, and technology use characteristics. pandemic showed higher odds of telehealth use during
Abbreviations: aOR: Adjusted odds ratio; CI: Confidence interval. the pandemic. The logistic regression model, including all
Table 3. Logistic regression of factors associated with telehealth use between male and female
Variables Male Female
Model 1 Model 2 Model 3 Model 1 Model 2 Model 3
OR CI OR CI OR CI OR CI OR CI OR CI
Age 0.99 0.95 – 1.04 0.99 0.95 – 1.03 1.02 0.97 – 1.07 0.96* 0.93 – 0.99 0.96* 0.93 – 0.99 0.97 0.94 – 1.01
Race (reference=white)
Black 0.89 0.39 – 2.04 0.86 0.37 – 1.99 0.95 0.38 – 2.36 1.51 0.93 – 2.46 1.46 0.89 – 2.38 1.56 0.92 – 2.66
Others 2.36* 1.06 – 5.24 2.27* 1.01 – 5.09 2.31 0.94 – 5.65 1.94 0.87 – 4.34 1.79 0.80 – 4.00 1.37 0.53 – 3.56
Marriage (reference=married/partnered)
Widowed 0.95 0.51 – 1.75 0.9 0.48 – 1.68 0.95 0.48 – 1.90 0.73 0.47 – 1.15 0.74 0.47 – 1.16 0.75 0.45 – 1.23
Unmarried 0.80 0.38 – 1.66 0.82 0.39 – 1.72 0.99 0.44 – 2.22 0.94 0.54 – 1.62 0.92 0.53 – 1.60 1.01 0.55 – 1.86
Per capital income (reference=1)
2 1.46 0.48 – 4.46 1.44 0.47 – 4.42 1.32 0.37 – 4.68 1.90* 1.04 – 3.49 1.94* 1.05 – 3.57 1.9 0.95 – 3.79
3 2.20 0.71 – 6.78 2.37 0.76 – 7.41 2.07 0.57 – 7.56 0.97 0.49 – 1.91 1.02 0.51 – 2.03 0.98 0.46 – 2.12
4 2.91 0.93 – 9.08 3.21* 1.02 – 10.16 2.44 0.67 – 8.94 1.98 0.97 – 4.05 2.18* 1.05 – 4.51 2.25 0.99 – 5.09
5 missing 2.47 0.82 – 7.43 2.51 0.82 – 7.65 2.39 0.68 – 8.43 1.16 0.66 – 2.05 1.2 0.68 – 2.13 1.39 0.73 – 2.63
Education (reference=1)
2 0.94 0.38 – 2.35 0.99 0.40 – 2.48 0.97 0.35 – 2.69 0.67 0.35 – 1.26 0.68 0.36 – 1.29 0.53 0.26 – 1.08
3 2.34 0.98 – 5.58 2.56* 1.07 – 6.16 1.84 0.67 – 5.05 0.90 0.47 – 1.72 0.91 0.48 – 1.75 0.55 0.26 – 1.17
4 1.64 0.72 – 3.71 1.89 0.83 – 4.33 1.35 0.51 – 3.57 1.17 0.62 – 2.20 1.23 0.65 – 2.33 0.7 0.34 – 1.47
Multimorbidity (reference=0)
Yes 1.74 0.97 – 3.11 2.03* 1.07 – 3.84 1.56 0.79 – 3.07 1.79 0.85 – 3.79
Self-reported health 1.21 0.97 – 1.50 1.17 0.92 – 1.47 1.15 0.95 – 1.39 1.28* 1.03 – 1.59
Digital use
Computer 1.9 0.87 – 4.16 1.1 0.67 – 1.81
Cellphone 0.59 0.27 – 1.27 0.91 0.49 – 1.71
Tablet 1.89* 1.13 – 3.14 2.07** 1.32 – 3.23
Learn new tech 2.29** 1.37 – 3.82 3.37*** 2.17 – 5.24
Constance 0.13 0.00 – 4.42 0.06 0.00 – 2.04 0.00* 0.00 – 0.34 6.16 0.39 – 98.23 3.32 0.19 – 57.12 0.48 0.01 – 15.99
N 560 560 520 709 709 662
Notes: *p<0.05; **p<0.01; ***p<0.001.
Abbreviations: CI: Confidence interval; OR: Odds ratio.
Volume 10 Issue 4 (2024) 120 https://doi.org/10.36922/ijps.1817