
Page 87 - IJPS-10-4
P. 87
International Journal of
Population Studies Migration and child mortality estimation
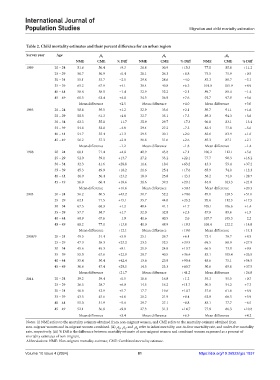
Table 2. Child mortality estimates and their percent difference for an urban region
Survey year Age q q q
1 0 4 1 5 0
NME CME % Diff NME CME % Diff NME CME % Diff
1989 20 – 24 51.6 56.4 +9.3 26.8 30.9 +15.3 77.0 85.6 +11.2
25 – 29 50.7 50.9 +0.4 26.1 26.3 +0.8 75.5 75.9 +0.5
30 – 34 55.1 53.7 −2.5 29.8 28.6 −4.0 83.3 80.7 −3.1
35 – 39 65.2 67.9 +4.1 38.4 40.8 +6.3 101.0 105.9 +4.9
40 – 44 58.8 58.0 −1.4 32.9 32.2 −2.1 89.7 88.4 −1.4
45 – 49 60.5 63.4 +4.8 34.3 36.9 +7.6 92.7 97.9 +5.6
Mean difference +2.5 Mean difference +4.0 Mean difference +3.0
1993 20 – 24 58.8 59.5 +1.2 32.9 33.6 +2.1 89.7 91.1 +1.6
25 – 29 58.5 61.3 +4.8 32.7 35.1 +7.3 89.3 94.3 +5.6
30 – 34 62.3 55.0 −11.7 35.9 29.7 −17.3 96.0 83.1 −13.4
35 – 39 54.6 52.0 −4.8 29.4 27.2 −7.5 82.4 77.8 −5.6
40 – 44 54.7 55.4 +1.3 29.5 30.1 +2.0 82.6 83.9 +1.6
45 – 49 56.2 57.3 +2.0 30.8 31.6 +2.6 85.3 87.1 +2.1
Mean difference −1.2 Mean difference −1.8 Mean difference −1.4
1998 20 – 24 68.1 71.4 +4.8 40.9 43.8 +7.1 106.2 112.1 +5.6
25 – 29 52.0 59.1 +13.7 27.2 33.2 +22.1 77.7 90.3 +16.2
30 – 34 32.3 41.6 +28.8 11.4 18.6 +63.2 43.3 59.4 +37.2
35 – 39 45.3 49.9 +10.2 21.6 25.4 +17.6 65.9 74.0 +12.3
40 – 44 40.9 50.4 +23.2 18.0 25.8 +43.3 58.2 74.9 +28.7
45 – 49 56.0 66.4 +18.6 30.6 39.5 +29.1 84.8 103.3 +21.8
Mean difference +16.6 Mean difference +30.4 Mean difference +20.3
2003 20 – 24 56.2 80.5 +43.2 30.7 52.2 +70.0 85.1 128.5 +51.0
25 – 29 62.1 71.5 +15.1 35.7 44.0 +23.2 95.6 112.3 +17.5
30 – 34 67.5 68.3 +1.2 40.4 41.1 +1.7 105.1 106.6 +1.4
35 – 39 57.7 58.7 +1.7 32.0 32.8 +2.5 87.9 89.6 +1.9
40 – 44 68.9 67.6 −1.9 41.6 40.5 −2.6 107.7 105.3 −2.2
45 – 49 68.2 77.1 +13.0 41.0 48.9 +19.3 106.4 122.2 +14.8
Mean difference +12.1 Mean difference +19.0 Mean difference +14.1
2008/9 20 – 24 49.5 51.4 +3.8 25.1 26.7 +6.4 73.4 76.7 +4.5
25 – 29 47.3 58.3 +23.3 23.3 32.5 +39.5 69.5 88.9 +27.9
30 – 34 45.6 49.3 +8.1 21.9 24.9 +13.7 66.5 73.0 +9.8
35 – 39 55.0 67.6 +22.9 29.7 40.5 +36.4 83.1 105.4 +26.8
40 – 44 35.4 50.4 +42.4 13.6 25.9 +90.4 48.6 75.1 +54.5
45 – 49 36.6 47.4 +29.5 14.5 23.3 +60.7 50.6 69.6 +37.5
Mean difference +21.7 Mean difference +41.2 Mean difference +26.8
2014 20 – 24 39.2 39.4 +0.5 16.6 16.8 +1.2 55.1 55.5 +0.7
25 – 29 36.5 38.7 +6.0 14.5 16.2 +11.7 50.5 54.2 +7.3
30 – 34 40.6 42.9 +5.7 17.7 19.6 +10.7 57.6 61.6 +6.9
35 – 39 43.5 45.6 +4.8 20.2 21.9 +8.4 62.8 66.5 +5.9
40 – 44 55.0 51.9 −5.6 29.7 27.1 −8.8 83.1 77.7 −6.5
45 – 49 52.1 56.8 +9.0 27.3 31.3 +14.7 77.9 86.3 +10.8
Mean difference +3.4 Mean difference +6.3 Mean difference +4.2
Notes: (i) NME refers to the mortality estimate obtained from non-migrant women, and CME refers to the mortality estimate obtained from
non-migrant women and in-migrant women combined. (ii) q , q , and q refer to infant mortality, one-to-four mortality rate, and under-five mortality
1 0 4 1
5 0
rate, respectively. (iii) % Diff is the difference between mortality estimate of non-migrant women and combined women expressed as a percent of
mortality estimates of non-migrant.
Abbreviations: NME: Non-migrant mortality estimate; CME: Combined mortality estimate.
Volume 10 Issue 4 (2024) 81 https://doi.org/10.36922/ijps.1837