
Page 36 - IJPS-11-1
P. 36
International Journal of
Population Studies Indian Census Rolls: Data for U.S. tribes
Table 3. Lummi population by marital status, 1937
Total (%) Married (%) Single (%) Widowed (%)
Population count
Lummi 661 197 419 45
Non-Lummi 66 55 6 5
Total 727 252 425 50
Population count
Lummi 100.0 29.8 63.4 6.8
Non-Lummi 100.0 83.3 9.1 7.6
Total 100.0 34.7 58.5 6.9
Source: National Archives (1965).
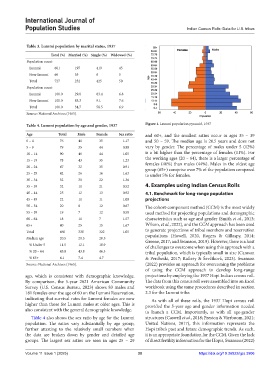
Table 4. Lummi population by age and gender, 1937 Figure 1. Lummi population pyramid, 1937
Age Total Male Female Sex ratio and 60+, and the smallest ratios occur in ages 35 – 39
0 – 4 76 41 35 1.17 and 50 – 59. The median age is 20.5 years and does not
5 – 9 79 35 44 0.80 vary by gender. The percentage of males under 5 (12%)
10 – 14 90 46 44 1.05 is a bit higher than the percentage of females (11%). For
15 – 19 78 43 35 1.23 the working ages (20 – 64), there is a larger percentage of
females (46%) than males (44%). Males in the oldest age
20 – 24 67 32 35 0.91
group (65+) comprise over 7% of the population compared
25 – 29 42 26 16 1.63 to under 5% for females.
30 – 34 52 30 22 1.36
35 – 39 32 11 21 0.52 4. Examples using Indian Census Rolls
40 – 44 25 12 13 0.92 4.1. Benchmark for long-range population
45 – 49 22 11 11 1.00 projections
50 – 54 20 8 12 0.67 The cohort-component method (CCM) is the most widely
55 – 59 19 7 12 0.58 used method for projecting populations and demographic
60 – 64 18 11 7 1.57 characteristics such as age and gender (Smith et al., 2013;
65+ 40 25 15 1.67 Wilson, et al., 2022), and the CCM approach has been used
Total 660 338 322 1.05 to generate projections of tribal members and reservation
Median age 20.5 20.5 20.5 populations (Howell, 2020, Rogers & Gillaspy, 2014;
Greene, 2017; and Swanson, 2019). However, there is a host
% Under 5 11.5 12.1 10.9
of challenges to overcome when using this approach with a
% 20 – 64 45.0 43.8 46.3 tribal population, which is typically small in size (Cannon
% 65+ 6.1 7.4 4.7 & Percheski, 2017; Raftery & Ševčiková, 2023). Swanson
Source: National Archives (1965). (2022) provides an approach for overcoming the problems
of using the CCM approach to develop long-range
ago, which is consistent with demographic knowledge. projections by employing the 1937 Hopi Indian census roll.
By comparison, the 5-year 2021 American Community The data from this census roll were assembled into an Excel
Survey (U.S. Census Bureau, 2023) shows 83 males and workbook using the same procedures described in section
181 females over the age of 60 on the Lummi Reservation, 2.3 for the Lummi tribe.
indicating that survival rates for Lummi females are now As with all of these rolls, the 1937 Hopi census roll
higher than those for Lummi males at older ages. This is provided the 5-year age and gender information needed
also consistent with the general demographic knowledge. to launch a CCM. Importantly, as with all age-gender
Table 4 also shows the sex ratio by age for the Lummi structures (Caswell et al., 2018; Preston & Vierboom, 2021;
population. The ratios vary substantially by age group, United Nations, 2017), this information represents the
further attesting to the relatively small numbers when Hopi tribe’s past and future demographic trends. As such,
the data are broken down by gender and detailed age it is an appropriate foundation for the CCM. Given the lack
groups. The largest sex ratios are seen in ages 25 – 29 of direct fertility information for the Hopis, Swanson (2022)
Volume 11 Issue 1 (2025) 30 https://doi.org/10.36922/ijps.3906