
Page 38 - IJPS-11-1
P. 38
International Journal of
Population Studies Indian Census Rolls: Data for U.S. tribes
Table 5. Hopi population by age and sex, 1900 – 1940
Age 1940 1930 1920 1910 1900
Males Females Total Males Females Total Males Females Total Males Females Total Males Females Total
0 – 9 443 442 886 394 389 783 344 337 680 293 284 577 242 233 475
10 – 19 345 356 701 308 307 615 268 260 528 230 210 440 185 168 353
20 – 29 292 311 603 261 268 530 229 227 456 199 183 382 161 148 308
30 – 39 218 209 427 205 191 396 191 174 365 179 155 334 162 140 303
40 – 49 169 123 292 145 106 251 121 89 210 97 73 170 74 55 129
50 – 59 112 91 203 104 84 188 97 77 173 89 69 159 81 63 144
60 – 69 124 91 216 108 81 189 92 71 163 75 62 137 61 50 111
70+ 100 60 160 76 52 127 53 41 95 31 31 62 15 15 30
Total 1,805 1,683 3,487 1,600 1,479 3,079 1,395 1,275 2,670 1,195 1,067 2,261 980 872 1,852
Source: Swanson and Tayman (2024).
epidemic diseases (Kunitz, 1974a, p. 14), the move to
a wage economy, a rapid decline in birth rates (Kunitz,
1974a, p. 14), and intra-tribal disagreements that led to
relocations within the reservation. There was also a major
split between those who cooperated with government
agencies and those who did not, a split that lasted at least
into the 1950s (Spicer, 1962, pp. 187 – 209).
As one example of the effects of these issues, the number
of Hopi tribal members aged 50 – 59 in 1940 increased
by only 57% over the number of members aged 40 – 49
in 1900. However, those aged 50 – 59 in 1940 were aged
30 – 39 in 1920, which put this cohort in an age group at
high risk of dying during the influenza pandemic of 1918
(Fujimura, 2003), a situation that also occurred among
the Navajos (Brady & Bahr, 2014). Kunitz (1974a, p. 9),
however, observed that epidemics and endemic diseases
were more devastating among the closely-settled Hopis
than among the Navajos.
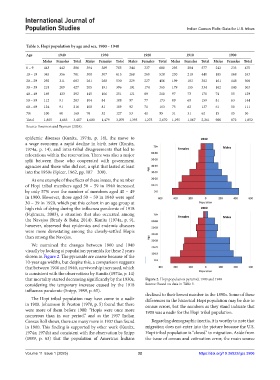
We examined the changes between 1900 and 1940
visually by looking at population pyramids for these 2 years
shown in Figure 2. The pyramids are coarse because of the
10-year age widths, but despite this, a comparison suggests
that between 1900 and 1940, survivorship increased, which
is consistent with the observations by Kunitz (1974a, p. 14)
that mortality started decreasing significantly by the 1930s, Figure 2. Hopi population pyramid, 1900 and 1940
considering the temporary increase caused by the 1918 Source: Based on data in Table 5.
influenza pandemic (Snipp, 1989, p. 65).
declined to their lowest number in the 1890s. Some of these
The Hopi tribal population may have come to a nadir differences in the historical Hopi population may be due to
in 1900. Johansson & Preston (1978, p. 5) found that there census errors, but the numbers as they stand indicate that
were more of them before 1900: “Hopis were once more 1900 was a nadir for the Hopi tribal population.
numerous than in our period,” and as the 1937 Indian
Census Roll shows, there are many more in 1937 than found Regarding demographic inertia, it is worthy to note that
in 1900. This finding is supported by other work (Kunitz, migration does not enter into the picture because the U.S.
1974a; 1974b) and consistent with the observation by Snipp Hopi tribal population is “closed” to migration. Aside from
(1989, p. 63) that the population of American Indians the issue of census and estimation error, the main source
Volume 11 Issue 1 (2025) 32 https://doi.org/10.36922/ijps.3906