
Page 97 - IJPS-11-1
P. 97
International Journal of
Population Studies Cultural values and workplace gender equity
Appendix
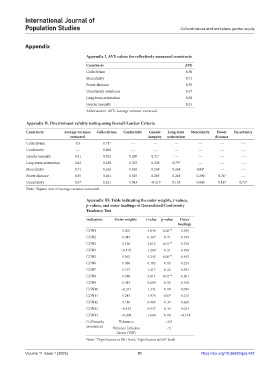
Appendix I. AVE values for reflectively measured constructs
Constructs AVE
Collectivism 0.50
Masculinity 0.71
Power distance 0.55
Uncertainty avoidance 0.57
Long-term orientation 0.62
Gender inequity 0.51
Abbreviation: AVE: Average variance extracted.
Appendix II. Discriminant validity testing using Fornell‑Larcker Criteria
Constructs Average variance Collectivism Conformity Gender Long‑term Masculinity Power Uncertainty
extracted inequity oreintation distance
Collectivism 0.5 0.71* --- --- --- --- --- ---
Conformity --- 0.206 --- --- --- --- --- ---
Gender inequity 0.51 0.052 0.280 0.71* --- --- --- ---
Long-term orientation 0.62 0.230 0.225 0.238 0.79* --- --- ---
Masculinity 0.71 0.165 0.365 0.558 0.264 0.84* --- ---
Power distance 0.55 0.261 0.315 0.285 0.216 0.290 0.74* ---
Uncertainty 0.57 0.251 0.043 −0.119 0.153 0.045 0.147 0.75*
Note: *Square root of average variance extracted.
Appendix III: Table indicating the outer weights, t‑values,
p-values, and outer loadings of Generalized Conformity
Tendency Test
Indicators Outer weights t‑value p‑value Outer
loadings
CON1 0.603 4.648 0.00** 0.550
CON2 0.049 0.367 0.71 0.189
CON3 0.428 2.612 0.01** 0.336
CON4 −0.175 1.269 0.21 0.298
CON5 0.563 4.245 0.00** 0.493
CON6 0.030 0.185 0.85 0.224
CON7 0.191 1.217 0.22 0.394
CON8 0.388 2.814 0.01** 0.301
CON9 0.015 0.099 0.92 0.198
CON10 −0.231 1.344 0.18 0.090
CON11 0.245 1.976 0.05* 0.215
CON12 0.110 0.905 0.37 0.268
CON13 −0.123 0.947 0.34 0.034
CON14 −0.208 1.666 0.10 −0.144
Collinearity Tolerance >0.2
assessment Variance Inflation <5
Factor (VIF)
Note: **Significance at 0.01 level; *Significance at 0.05 level.
Volume 11 Issue 1 (2025) 91 https://doi.org/10.36922/ijps.422