
Page 54 - IJPS-11-2
P. 54
International Journal of
Population Studies Single mother spatial distribution in Nigeria
Table 1. Parameter estimates for the categorical variables
included as linear effects
Variable Odds Standard 95% credible
ratio error interval
Place of residence
Rural 1
Urban 1.662 0.033 1.561, 1.770
Working status
No 1
Yes 0.961 0.032 0.903, 1.022
Access to newspapers
No 1
Yes 1.103 0.038 1.025, 1.188
Access to the radio
No 1
Yes 0.788 0.031 0.742, 0.837
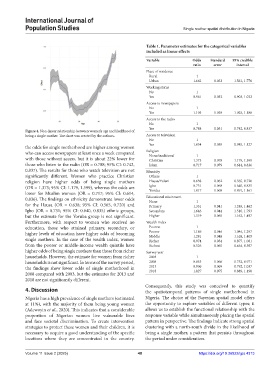
Figure 4. Non-linear relationship between women’s age and likelihood of
being a single mother. The chart was created by the authors. Access to television
No 1
Yes 1.054 0.035 0.985, 1.127
the odds for single motherhood are higher among women
who can access newspapers at least once a week compared Religion 1
None/traditional
with those without access, but it is about 22% lower for Christian 1.373 0.078 1.179, 1.599
those who listen to the radio (OR = 0.788; 95% CI: 0.742, Islam 0.717 0.079 0.614, 0.836
0.837). The results for those who watch television are not Ethnicity
significantly different. Women who practice Christian Others 1
religion have higher odds of being single mothers Hausa/Fulani 0.638 0.062 0.565, 0.720
(OR = 1.373; 95% CI: 1.179, 1.599), whereas the odds are Igbo 0.731 0.068 0.640, 0.835
0.891, 1.161
0.068
Yoruba
1.017
lower for Muslim women (OR = 0.717; 95% CI: 0.614,
0.836). The findings on ethnicity demonstrate lower odds Educational attainment 1
None
for the Hausa (OR = 0.638; 95% CI: 0.565, 0.720) and Primary 1.351 0.041 1.249, 1.462
Igbo (OR = 0.731; 95% CI: 0.640, 0.835) ethnic groups, Secondary 1.646 0.044 1.510, 1.793
but the estimate for the Yoruba group is not significant. Higher 1.319 0.065 1.162, 1.497
Furthermore, with respect to women who received no Wealth index
education, those who attained primary, secondary, or Poorest 1
higher levels of education have higher odds of becoming Poorer 1.186 0.046 1.084, 1.297
Middle
1.168, 1.405
0.048
1.281
single mothers. In the case of the wealth index, women Richer 0.974 0.054 0.877, 1.081
from the poorer or middle-income wealth quintile have Richest 0.526 0.065 0.464, 0.597
higher odds of being single mothers than those from richer Survey year
households. However, the estimate for women from richer 2003 1
households is not significant. In terms of the survey period, 2008 0.855 0.066 0.752, 0.971
the findings show lower odds of single motherhood in 2013 0.906 0.069 0.792, 1.037
2008 compared with 2003, but the estimates for 2013 and 2018 1.027 0.075 0.889, 1.190
2018 are not significantly different.
Consequently, this study was conceived to quantify
4. Discussion the spatiotemporal patterns of single motherhood in
Nigeria has a high prevalence of single mothers (estimated Nigeria. The choice of the Bayesian spatial model offers
at 11%), with the majority of them being young women the opportunity to explore variables of different types; it
(Adewoyin et al., 2020). This indicates that a considerable allows us to establish the functional relationship with the
proportion of Nigerian women live vulnerable lives response variable while simultaneously placing the spatial
and face societal discrimination. To create intervention pattern in perspective. The findings indicate strong spatial
strategies to protect these women and their children, it is clustering with a north-south divide in the likelihood of
necessary to acquire a good understanding of the specific being a single mother, a pattern that persists throughout
locations where they are concentrated in the country. the period under consideration.
Volume 11 Issue 2 (2025) 48 https://doi.org/10.36922/ijps.4313