
Page 75 - IJPS-11-2
P. 75
International Journal of
Population Studies Health-care access for the elderly living alone
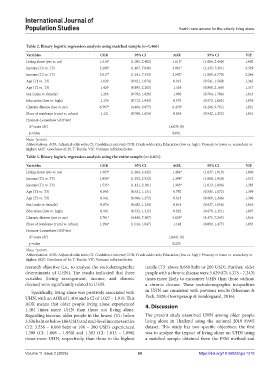
Table 2. Binary logistic regression analysis using matched sample (n=1,466)
Variables COR 95% CI AOR 95% CI VIF
Living alone (yes vs. no) 1.614* (1.085, 2.402) 1.613* (1.066, 2.440) 1.002
Income (T1 vs. T3) 3.280* (1.407, 7.648) 3.001* (1.235, 7.291) 2.339
Income (T2 vs. T3) 3.017* (1.241, 7.333) 2.692* (1.069, 6.779) 2.246
Age (T1 vs. T3) 1.020 (0.621, 1.674) 0.919 (0.541, 1.560) 1.342
Age (T2 vs. T3) 1.429 (0.895, 2.283) 1.324 (0.808, 2.169) 1.317
Sex (male vs. female) 1.203 (0.792, 1.828) 1.096 (0.704, 1.706) 1.013
Education (low vs. high) 1.176 (0.712, 1.943) 0.975 (0.572, 1.662) 1.076
Chronic disease (yes vs. no) 6.597* (4.406, 9.877) 6.478* (4.286, 9.791) 1.021
Place of residence (rural vs. urban) 1.121 (0.760, 1.654) 0.824 (0.542, 1.252) 1.051
Hosmer–Lemeshow GOF test
X score (df) 14.035 (8)
2
p-value 0.081
Note: *p<0.05.
Abbreviations: AOR: Adjusted odds ratio; CI: Confidence interval; COR: Crude odds ratio; Education (low vs. high): Primary or lower vs. secondary or
higher; GOF: Goodness-of-fit; T: Tercile; VIF: Variance inflation factor.
Table 3. Binary logistic regression analysis using the entire sample (n=4.611)
Variables COR 95% CI AOR 95% CI VIF
Living alone (yes vs. no) 1.683* (1.264, 2.242) 1.404* (1.027, 1.919) 1.096
Income (T1 vs. T3) 1.850* (1.352, 2.532) 1.398* (1.008, 1.950) 1.512
Income (T2 vs. T3) 1.535* (1.121, 2.101) 1.383* (1.013, 1.896) 1.385
Age (T1 vs. T3) 0.845 (0.631, 1.131) 0.792 (0.585, 1.072) 1.399
Age (T2 vs. T3) 0.941 (0.696, 1.272) 0.913 (0.669, 1.246) 1.390
Sex (male vs. female) 0.876 (0.682, 1.124) 0.814 (0.627, 1.056) 1.016
Education (low vs. high) 0.981 (0.732, 1.315) 0.922 (0.679, 1.251) 1.037
Chronic disease (yes vs. no) 5.701* (4.448, 7.307) 5.629* (4.375, 7.243) 1.016
Place of residence (rural vs. urban) 1.294* (1.016, 1.647) 1.148 (0.892, 1.477) 1.033
Hosmer–Lemeshow GOF test
X score (df) 10.601 (8)
2
p-value 0.225
Note: *p<0.05.
Abbreviations: AOR: Adjusted odds ratio; CI: Confidence interval; COR: Crude odds ratio; Education (low vs. high): Primary or lower vs. secondary or
higher; GOF: Goodness-of-fit; T: Tercile; VIF: Variance inflation factor.
research objective (i.e., to analyze the sociodemographic tercile (T3: above 8,660 baht or 260 USD). Further, older
determinants of UHN). The results indicated that three people with a chronic disease were 5.629 (CI: 4.375 – 7.243)
variables (living arrangement, income, and chronic times more likely to encounter UHN than those without
disease) were significantly related to UHN. a chronic disease. These sociodemographic inequalities
Specifically, living alone was positively associated with in UHN are consistent with previous results (Meemon &
UHN, with an AOR of 1.404 and a CI of 1.027 – 1.919. This Paek, 2020; Osornprasop & Sondergaard, 2016).
AOR means that older people living alone experienced 4. Discussion
1.404 times more UHN than those not living alone.
Regarding income, older people in the lowest (T1: below The present study examined UHN among older people
3,536 baht or below 106 USD) and mid-level income terciles living alone in Thailand using the national 2019 HWS
(T2: 3.536 – 8.660 baht or 106 – 260 USD) experienced dataset. This study has two specific objectives: the first
1.398 (CI: 1.008 – 1.950) and 1.383 (CI: 1.013 – 1.896) was to analyze the impact of living alone on UHN using
times more UHN, respectively, than those in the highest a matched sample obtained from the PSM method and
Volume 11 Issue 2 (2025) 69 https://doi.org/10.36922/ijps.1218