
Page 44 - IJPS-11-4
P. 44
International Journal of
Population Studies Stress in early adulthood
Appendix
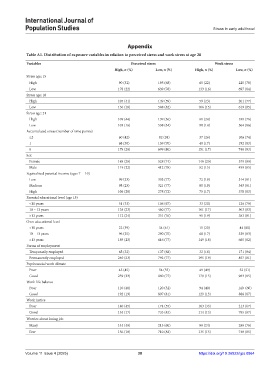
Table A1. Distribution of exposure variables in relation to perceived stress and work stress at age 28
Variables Perceived stress Work stress
High, n (%) Low, n (%) High, n (%) Low, n (%)
Stress age: 15
High 90 (32) 195 (68) 65 (22) 225 (78)
Low 178 (22) 639 (78) 133 (16) 697 (84)
Stress age: 18
High 105 (41) 149 (59) 59 (23) 201 (77)
Low 130 (18) 588 (82) 106 (15) 619 (85)
Stress age: 21
High 109 (44) 139 (56) 61 (24) 189 (76)
Low 103 (16) 538 (84) 90 (14) 564 (86)
Accumulated stress (number of time points)
≥2 60 (42) 82 (58) 37 (26) 106 (74)
1 68 (30) 159 (70) 40 (17) 192 (83)
0 179 (20) 699 (80) 151 (17) 740 (83)
Sex
Female 188 (26) 528 (74) 146 (20) 579 (80)
Male 119 (22) 412 (78) 82 (15) 459 (85)
Equivalized parental income (ages 7 – 10)
Low 99 (23) 333 (77) 72 (19) 314 (81)
Medium 98 (23) 321 (77) 80 (19) 343 (81)
High 106 (28) 278 (72) 75 (17) 370 (83)
Parental educational level (age 15)
<10 years 51 (33) 106 (67) 33 (20) 126 (79)
10 – 13 years 138 (23) 460 (77) 101 (17) 503 (83)
>13 years 112 (24) 351 (76) 91 (19) 383 (81)
Own educational level
<10 years 22 (39) 34 (61) 11 (20) 44 (80)
10 – 13 years 96 (25) 290 (75) 68 (17) 329 (83)
>13 years 189 (23) 616 (77) 149 (18) 665 (82)
Forms of employment
Temporarily employed 65 (32) 137 (68) 32 (16) 171 (84)
Permanently employed 240 (23) 792 (77) 195 (19) 857 (81)
Psychosocial work climate
Poor 45 (45) 54 (55) 49 (49) 52 (51)
Good 259 (23) 880 (77) 179 (15) 983 (85)
Work-life balance
Poor 110 (48) 120 (52) 94 (40) 140 (60)
Good 192 (19) 807 (81) 129 (13) 886 (87)
Work justice
Poor 140 (45) 174 (55) 103 (33) 213 (67)
Good 154 (17) 733 (83) 114 (13) 795 (87)
Worries about losing job
Many 144 (40) 215 (60) 88 (24) 280 (76)
Few 156 (18) 710 (82) 135 (15) 748 (85)
Volume 11 Issue 4 (2025) 38 https://doi.org/10.36922/ijps.0864