
Page 13 - IJPS-2-2
P. 13
Danan Gu, Runlong Huang, Kirill Andreev, et al.
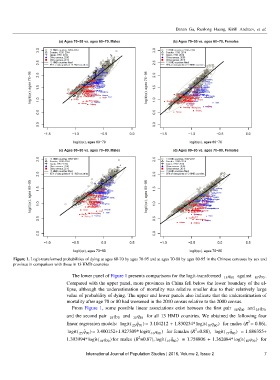
Figure 1. Logit-transformed probabilities of dying at ages 60-70 by ages 70-95 and at ages 70-80 by ages 80-95 in the Chinese censuses by sex and
province in comparison with those in 13 HMD countries
The lower panel of Figure 1 presents comparisons for the logit-transformed 15 80 10 70
q against
q .
Compared with the upper panel, more provinces in China fell below the lower boundary of the el-
lipse, although the underestimation of mortality was relative smaller due to their relatively large
value of probability of dying. The upper and lower panels also indicate that the underestimation of
mortality after age 70 or 80 had worsened in the 2010 census relative to the 2000 census.
q
q and
From Figure 1, some possible linear associations exist between the first pair 10 60 25 70
q for all 13 HMD countries. We obtained the following four
q and
and the second pair 10 70 15 80
2
linear regression models: logit( q ˆ ) = 3.104212 + 1.830234* logit( q ) for males (R = 0.86),
10 60
25 70
2
logit( q ˆ ) = 3.400152+1.927309* logit( q ) for females (R =0.88), logit( q ˆ ) = 1.686355+
25 70
15 80
10 60
2
1.393994* logit( q ) for males (R =0.87), logit( q ˆ ) = 1.758806 + 1.362084* logit( q ) for
15 80
10 70
10 70
International Journal of Population Studies | 2016, Volume 2, Issue 2 7