
Page 15 - IJPS-2-2
P. 15
Danan Gu, Runlong Huang, Kirill Andreev, et al.
age-trajectories for females fit the Kannisto curve better than for males. We also found that the age
trajectory for the 2010 census fit the Kannisto model better than for the 2000 census. More socioec-
onomically developed provinces — such as Beijing and Shanghai — generally had better fit than
those in relatively less developed provinces. However, it is also important to note that Hainan, Tibet,
and Xinjiang where deaths rates are supposed to be less accurate had a value of RMSE as low as or
even lower than Shanghai and Beijing. This suggests potentially systematic underreports of death at
ages 60 to 70 in these remote provinces, a finding that concurs with our earlier estimates.
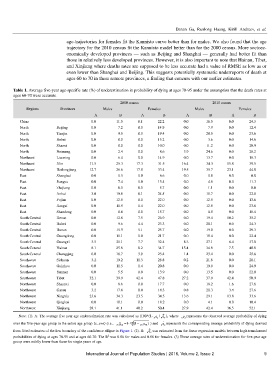
Table 1. Average five-year age-specific rate (%) of underestimation in probability of dying at ages 70-95 under the assumption that the death rates at
ages 60-70 were accurate
2000 census 2010 census
Regions Provinces Males Females Males Females
A B A B A B A B
China 0.0 11.5 0.1 22.2 0.0 16.5 0.0 24.3
North Beijing 0.0 7.2 0.0 14.9 0.0 7.9 0.0 12.4
North Tianjin 0.0 9.5 0.0 19.4 0.0 20.5 0.0 23.6
North Hebei 0.0 0.0 0.0 15.2 0.0 3.6 0.0 14.6
North Shanxi 0.0 0.0 0.0 10.0 0.0 11.2 0.0 20.9
North Neimeng 0.0 2.4 0.0 8.6 3.9 24.6 0.0 28.2
Northeast Liaoning 0.0 6.4 0.0 14.9 0.0 13.7 0.0 18.3
Northeast Jilin 11.5 25.3 17.3 31.5 16.4 34.3 15.8 39.5
Northeast Heilongjiang 12.7 26.6 17.9 33.4 19.5 35.7 23.1 44.0
East Shanghai 0.0 0.5 0.0 6.6 0.0 0.8 0.0 0.0
East Jiangsu 0.0 7.4 0.0 15.4 0.0 4.9 0.0 11.3
East Zhejiang 0.0 0.0 0.0 5.7 0.0 1.1 0.0 0.0
East Anhui 3.0 19.6 0.1 24.5 0.0 15.7 0.0 22.8
East Fujian 0.0 12.5 0.0 22.0 0.0 12.5 0.0 13.6
East Jiangxi 0.0 11.9 1.4 22.0 0.0 12.5 0.0 23.6
East Shandong 0.0 0.8 0.0 15.7 0.0 8.5 0.0 18.4
South Central Henan 0.0 12.8 7.5 26.9 0.0 19.4 10.2 35.2
South Central Hubei 0.0 9.6 4.4 23.3 0.0 20.1 0.0 24.3
South Central Hunan 0.0 15.9 5.1 25.7 0.0 19.0 0.0 29.3
South Central Guangdong 0.0 11.1 0.0 21.7 0.0 18.4 0.0 22.4
South Central Guangxi 3.5 21.1 7.7 32.4 8.3 27.1 6.4 37.0
South Central Hainan 8.1 25.8 8.2 34.7 15.4 34.8 7.5 40.8
South Central Chongqing 0.0 16.7 3.9 23.4 1.4 23.4 0.0 25.6
Southwest Sichuan 3.2 19.2 11.3 28.8 0.2 21.8 0.0 28.1
Southwest Guizhou 0.0 11.5 1.4 20.8 0.0 19.0 0.0 24.9
Southwest Yunnan 0.0 5.5 0.0 13.9 0.0 13.5 0.0 22.0
Southwest Tibet 32.1 39.9 42.4 47.8 27.2 37.9 42.4 50.9
Northwest Shaanxi 0.0 8.6 0.0 17.7 0.0 18.2 1.6 27.6
Northwest Gansu 3.2 17.8 0.0 14.3 0.8 20.3 3.4 27.6
Northwest Ningxia 23.6 34.3 23.5 34.5 13.6 29.1 13.8 33.6
Northwest Qinghai 0.0 10.1 0.0 18.2 0.0 4.1 0.0 10.4
Northwest Xinjiang 28.1 41.1 40.2 50.4 27.9 42.4 36.5 52.1
Note: (1). A: The average five year age underestimation rate was calculated as (100*(1- q / ˆ q ), where q represents the observed average probability of dying
n x
n
x
n
x
ˆ
over the five-year age group in the entire age group [x, x+n) (i.e., 25 q =1- 1/5 (1− 25 70 ) ) and q represents the corresponding average probability of dying derived
q
70
n x
ˆ
from fitted estimates of the low boundary of the confidence ellipse in Figure 1. (2). B: q was estimated from the linear regression models between logit-transformed
n x
2
probabilities of dying at ages 70-95 and at ages 60-70. The R was 0.86 for males and 0.88 for females. (3) These average rates of underestimation for five-year age
group were mildly lower than those for single years of age.
International Journal of Population Studies | 2016, Volume 2, Issue 2 9