
Page 19 - IJPS-2-2
P. 19
Danan Gu, Runlong Huang, Kirill Andreev, et al.
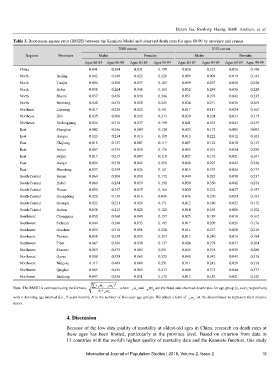
Table 3. Root-mean-square error (RMSE) between the Kannisto Model and observed death rates for ages 80-99 by province and census
2000 census 2010 census
Regions Provinces Males Females Males Females
Ages 80-89 Ages 90-99 Ages 80-89 Ages 90-99 Ages 80-89 Ages 90-99 Ages 80-89 Ages 90-99
China 0.041 0.294 0.031 0.159 0.026 0.233 0.026 0.190
North Beijing 0.042 0.249 0.022 0.228 0.009 0.098 0.019 0.142
North Tianjin 0.054 0.306 0.037 0.183 0.039 0.297 0.030 0.226
North Hebei 0.056 0.264 0.048 0.163 0.052 0.249 0.056 0.229
North Shanxi 0.057 0.456 0.039 0.246 0.051 0.278 0.042 0.235
North Neimeng 0.040 0.478 0.050 0.245 0.034 0.271 0.036 0.269
Northeast Liaoning 0.017 0.228 0.022 0.141 0.017 0.117 0.024 0.162
Northeast Jilin 0.035 0.306 0.032 0.213 0.039 0.224 0.033 0.215
Northeast Heilongjiang 0.054 0.316 0.037 0.199 0.041 0.263 0.043 0.235
East Shanghai 0.002 0.246 0.009 0.120 0.023 0.173 0.001 0.092
East Jiangsu 0.023 0.234 0.013 0.109 0.013 0.222 0.012 0.163
East Zhejiang 0.018 0.127 0.007 0.117 0.007 0.122 0.010 0.135
East Anhui 0.067 0.335 0.050 0.178 0.055 0.291 0.054 0.289
East Fujian 0.017 0.215 0.007 0.110 0.027 0.176 0.021 0.167
East Jiangxi 0.054 0.370 0.042 0.208 0.048 0.297 0.042 0.256
East Shandong 0.037 0.259 0.026 0.141 0.015 0.193 0.026 0.173
South Central Henan 0.064 0.308 0.058 0.172 0.049 0.282 0.050 0.237
South Central Hubei 0.060 0.254 0.050 0.192 0.039 0.350 0.042 0.278
South Central Hunan 0.050 0.347 0.035 0.164 0.020 0.232 0.027 0.187
South Central Guangdong 0.020 0.139 0.016 0.098 0.036 0.270 0.024 0.183
South Central Guangxi 0.022 0.221 0.026 0.171 0.012 0.180 0.022 0.172
South Central Hainan 0.038 0.213 0.023 0.128 0.014 0.163 0.006 0.102
Southwest Chongqing 0.050 0.360 0.040 0.157 0.025 0.189 0.018 0.162
Southwest Sichuan 0.044 0.248 0.035 0.185 0.017 0.209 0.021 0.176
Southwest Guizhou 0.054 0.318 0.051 0.226 0.011 0.237 0.020 0.218
Southwest Yunnan 0.038 0.339 0.033 0.203 0.013 0.240 0.016 0.194
Southwest Tibet 0.067 0.366 0.038 0.137 0.024 0.278 0.037 0.204
Northwest Shaanxi 0.083 0.475 0.063 0.251 0.043 0.318 0.038 0.280
Northwest Gansu 0.089 0.559 0.065 0.323 0.043 0.342 0.041 0.316
Northwest Ningxia 0.117 0.468 0.066 0.251 0.011 0.242 0.028 0.216
Northwest Qinghai 0.085 0.436 0.083 0.413 0.048 0.373 0.044 0.373
Northwest Xinjiang 0.047 0.238 0.031 0.172 0.013 0.152 0.021 0.152
∑ ˆ m − n m ) 2
Note: The RMSE is estimated using the formula ( n x x , where m and m are the fitted and observed death rates for age group [x, x+n), respectively,
ˆ
N * n m x n x n x
with n denoting age interval (i.e., 5 years herein); N is the number of five-year age groups. We added a term of m in the denominator to represent their relative
x
n
errors.
4. Discussion
Because of the low data quality of mortality at oldest-old ages in China, research on death rates at
these ages has been limited, particularly at the province level. Based on criterion from data in
13 countries with the world's highest quality of mortality data and the Kannisto function, this study
International Journal of Population Studies | 2016, Volume 2, Issue 2 13