
Page 119 - IJPS-3-1
P. 119
Tareque MI and Saito Y
BDHS. By combining these data, we estimated HFLE for the study population. See
the manual (Jagger, Cox, Le Roy et al., 2006) for more details on the computation of
HFLE and confidence intervals using the Sullivan method. To take into account the
population living in institutions who were excluded from the 2011 BDHS, we assumed
that the prevalence of HTN outside and within institutions does not differ.
2.4 Analysis Plan
We examined the prevalence of HTN by age and sex first. We used STATA/MP version
13.0 (StataCorp LP, College Station, Texas, USA) to perform a two-sided test for
equality of proportions in HTN. Sample weights were applied to accommodate the
complex survey design. Estimates of HFLE and LE with different types of HTN were
then obtained using the Sullivan method. Finally, the estimates of HFLE and LE with
different types of HTN were plotted in graph form.
3 Results
Table 1 shows gender differences for different types of HTN prevalence in Bangladesh
in 2011. A significantly greater percentage of women have HTN than men (32% of
women vs. 19% of men). Among all individuals with HTN, individuals unaware of
HTN make up the largest group (56% of men vs. 45% of women), followed by those
with uncontrolled HTN (20% of men vs. 25% of women), controlled HTN (16% of
men vs. 20% of women), and those aware of HTN but not in treatment (8% of men vs.
11% of women) (results not shown).
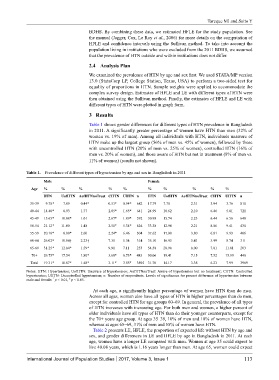
Table 1. Prevalence of different types of hypertension by age and sex in Bangladesh in 2011
Male Female
Age % % % % % % % % % %
HTN UofHTN AofHTNnoTreat CHTN UHTN n HTN UofHTN AofHTNnoTreat CHTN UHTN n
35-39 9.78* 7.89 0.44* 0.51* 0.94* 682 17.79 7.78 2.31 3.94 3.76 810
40-44 14.40* 8.93 1.77 2.05* 1.65* 641 24.99 10.62 2.10 6.46 5.81 721
45-49 15.65* 10.08* 1.01 2.67* 1.89* 592 30.98 15.74 2.23 6.44 6.56 648
50-54 21.12* 11.80 1.48 2.50* 5.34* 626 33.38 12.90 2.21 8.86 9.41 430
55-59 20.10* 8.80* 2.60 2.24* 6.46 304 37.62 17.08 3.80 6.81 9.93 406
60-64 26.02* 10.94† 2.23† 7.31 5.54 314 35.10 16.95 5.41 3.99 8.74 311
65-69 31.25* 12.64* 1.59* 9.91 7.11 253 54.58 28.96 6.00 7.81 11.81 203
70+ 29.75* 17.54 1.80* 3.68* 6.73* 483 50.06 19.41 7.15 7.52 15.99 440
Total 19.31* 10.87* 1.48* 3.11* 3.85* 3895 31.76 14.17 3.38 6.23 7.99 3969
Notes: HTN: Hypertension; UofHTN: Unaware of hypertension; AofHTNnoTreat: Aware of hypertension but no treatment; CHTN: Controlled
hypertension; UHTN: Uncontrolled hypertension; n: Number of respondents. Levels of significance for percent difference of hypertension between
†
*
male and female: p < 0.01, p < 0.05.
At each age, a significantly higher percentage of women have HTN than do men.
Across all ages, women also have all types of HTN in higher percentages than do men,
except for controlled HTN for age groups 60–69. In general, the prevalence of all types
of HTN increases with increasing age. For both men and women, a higher percent of
older individuals have all types of HTN than do their younger counterparts, except for
the 70+ years age group. At ages 35–39, 10% of men and 18% of women have HTN,
whereas at ages 65–69, 31% of men and 55% of women have HTN.
Table 2 presents LE, HFLE, the proportion of expected life without HTN by age and
sex, and gender differences in LE and HFLE by age in Bangladesh in 2011. At each
age, women have a longer LE compared with men. Women at age 35 could expect to
live 40.08 years, which is 1.16 years longer than men. At age 65, women could expect
International Journal of Population Studies 2017, Volume 3, Issue 1 113