
Page 120 - IJPS-3-1
P. 120
Gender differences in hypertension-free life expectancy in Bangladesh
to live 0.32 years (117 days) longer than men. The differences in LE decrease with
increasing ages.
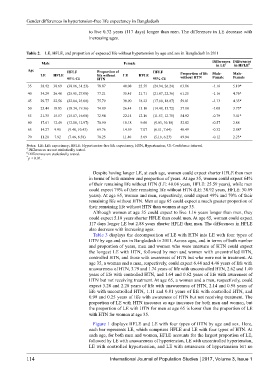
Table 2. LE, HFLE, and proportion of expected life without hypertension by age and sex in Bangladesh in 2011
Male Female Differences Differences
§
in LE
†
in HFLE
Age HFLF Proportion of HFLF
LE HFLE life without LE HFLE Proportion of life Male- Male-
95% CI HTN 95% CI without HTN Female Female
35 38.92 30.69 (30.16, 31.23) 78.87 40.08 25.59 (24.94, 26.24) 63.86 -1.16 5.10*
40 34.29 26.48 (25.95, 27.00) 77.21 35.45 21.71 (21.07, 22.36) 61.25 -1.16 4.76*
45 29.77 22.56 (22.04, 23.08) 75.79 30.90 18.23 (17.60, 18.87) 59.01 -1.13 4.33*
50 25.44 18.85 (18.34, 19.36) 74.09 26.44 15.10 (14.48, 15.72) 57.10 -1.00 3.75*
55 21.35 15.57 (15.07, 16.08) 72.94 22.14 12.16 (11.57, 12.75) 54.92 -0.79 3.41*
60 17.61 12.49 (12.00, 12.97) 70.90 18.18 9.60 (9.03, 10.18) 52.82 -0.57 2.88
65 14.27 9.95 (9.48, 10.43) 69.76 14.59 7.07 (6.51, 7.64) 48.49 -0.32 2.88*
70 11.28 7.92 (7.46, 8.38) 70.25 11.40 5.69 (5.16, 6.23) 49.94 -0.12 2.23*
Notes: LE: Life expectancy; HFLE: Hypertension-free life expectancy; HTN, Hypertension; CI: Confidence interval.
† Differences are not statistically tested.
§ Differences are statistically tested.
* p < 0.01.
Despite having longer LE, at each age, women could expect shorter HFLE than men
in terms of both number and proportion of years. At age 35, women could expect 64%
of their remaining life without HTN (LE: 40.08 years, HFLE: 25.59 years), while men
could expect 79% of their remaining life without HTN (LE: 38.92 years, HFLE: 30.69
years). At age 65, women and men, respectively, could expect 49% and 70% of their
remaining life without HTN. Men at age 65 could expect a much greater proportion of
their remaining life without HTN than women at age 35.
Although women at age 35 could expect to live 1.16 years longer than men, they
could expect 5.10 years shorter HFLE than could men. At age 65, women could expect
117 days longer LE but 2.88 years shorter HFLE than men. The differences in HFLE
also decrease with increasing ages.
Table 3 displays the decomposition of LE with HTN into LE with four types of
HTN by age and sex in Bangladesh in 2011. Across ages, and in terms of both number
and proportion of years, men and women who were unaware of HTN could expect
the longest LE with HTN, followed by men and women with uncontrolled HTN,
controlled HTN, and those with awareness of HTN but who were not in treatment. At
age 35, a woman and a man, respectively, could expect 6.44 and 4.46 years of life with
unawareness of HTN, 3.79 and 1.74 years of life with uncontrolled HTN, 2.62 and 1.40
years of life with controlled HTN, and 1.64 and 0.62 years of life with awareness of
HTN but not receiving treatment. At age 65, a woman and a man, respectively, could
expect 3.28 and 2.28 years of life with unawareness of HTN, 2.14 and 0.98 years of
life with uncontrolled HTN, 1.11 and 0.81 years of life with controlled HTN, and
0.99 and 0.25 years of life with awareness of HTN but not receiving treatment. The
proportion of LE with HTN increases as age increases for both men and women, but
the proportion of LE with HTN for men at age 65 is lower than the proportion of LE
with HTN for women at age 35.
Figure 1 displays HFLE and LE with four types of HTN by age and sex. Here,
each bar represents LE, which comprises HFLE and LE with four types of HTN. At
each age, for both men and women, HFLE accounts for the largest proportion of LE,
followed by LE with unawareness of hypertension, LE with uncontrolled hypertension,
LE with controlled hypertension, and LE with awareness of hypertension but no
114 International Journal of Population Studies 2017, Volume 3, Issue 1