
Page 38 - IJPS-3-1
P. 38
Immigration-related stressors and mental health problems among Asian-American Immigrants
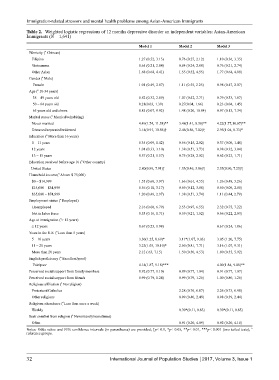
Table 2. Weighted logistic regressions of 12 months depressive disorder on independent variables: Asian-American
Immigrants (N = 1,641)
Model 1 Model 2 Model 3
Ethnicity ( Chinese)
a
Filipino 1.27 (0.52, 3.13) 0.76 (0.27, 2.12) 1.10 (0.36, 3.35)
Vietnamese 0.65 (0.21, 2.04) 0.84 (0.24, 2.88) 0.76 (0.21, 2.74)
Other Asian 1.68 (0.64, 4.41) 1.55 (0.52, 4.55) 1.77 (0.64, 4.89)
Gender ( Male)
a
Female 1.01 (0.49, 2.07) 1.11 (0.55, 2.25) 0.98 (0.47, 2.07)
a
Age ( 18-34 years)
35 – 49 years old 0.82 (0.32, 2.09) 1.07 (0.42, 2.71) 0.79 (0.33, 1.87)
50 – 64 years old 0.21(0.03, 1.39) 0.27(0.04, 1.66) 0.23 (0.04, 1.45)
65 years old and above 0.85 (0.07, 9.92) 1.48 (0.20, 10.84) 0.97 (0.13, 7.34)
a
Marital status ( Married/cohabiting)
Never married 4.49(1.74, 11.58)** 3.48(1.41, 8.58)** 4.22(1.77,10.07)**
Divorced/separated/widowed 3.14(0.91, 10.86)† 2.46(0.86, 7.02)† 2.95(1.04, 8.33)*
a
Education ( More than 16 years)
0 – 11 years 0.35 (0.09, 1.42) 0.56 (0.15, 2.02) 0.37 (0.09, 1.48)
12 years 1.01 (0.33, 3.10) 1.38 (0.51, 3.73) 0.98 (0.32, 3.04)
13 – 15 years 0.57 (0.21, 1.57) 0.75 (0.28, 2.02) 0.62 (0.23, 1.71)
a
Education received before age 16 ( Other country)
United States 2.80(0.99, 7.91)† 1.33(0.46, 3.86)† 2.55(0.90, 7.25)†
Household income( Above $ 75,000)
a
$0 – $14,999 1.55 (0.60, 3.97) 1.66 (0.61, 4.55) 1.26 (0.48, 3.26)
$15,000 – $34,999 0.56 (0.10, 3.17) 0.69 (0.12, 3.88) 0.50 (0.09, 2.80)
$35,000 – $74,999 1.20 (0.49, 2.97) 1.38 (0.51, 3.74) 1.11 (0.44, 2.79)
a
Employment status ( Employed)
Unemployed 2.16 (0.68, 6.79) 2.53 (0.97, 6.55) 2.32 (0.75, 7.22)
Not in labor force 0.53 (0.16, 1.71) 0.59 (0.21, 1.62) 0.66 (0.22, 2.03)
a
Age at immigration ( > 12 years)
≤ 12 years 0.67 (0.23, 1.98) 0.67 (0.24, 1.86)
Years in the U.S. ( Less than 5 years)
a
5 – 10 years 3.30(1.25, 8.69)* 3.11*(1.07, 9.03) 3.05 (1.20, 7.75)
11 – 20 years 3.23(1.03, 10.10)* 2.50 (0.81, 7.71) 3.16 (1.07, 9.31)
More than 20 years 2.12 (.63, 7.15) 1.50 (0.50, 4.53) 1.80 (0.55, 5.92)
a
English proficiency ( Excellent/good)
Fair/poor 4.14(1.87, 9.18)*** 4.09(1.84, 9.08)**
Perceived social support from family members 0.92 (0.77, 1.10) 0.89 (0.77, 1.04) 0.91 (0.77, 1.07)
Perceived social support from friends 0.99 (0.79, 1.24) 0.99 (0.79, 1.26) 1.00 (0.80, 1.26)
a
Religious affiliation ( No religion)
Protestant/Catholics 2.28 (0.76, 6.87) 2.26 (0.73, 6.98)
Other religions 0.99 (0.40, 2.49) 0.98 (0.39, 2.44)
a
Religious attendance ( Less than once a week)
Weekly 0.30*(0.11, 0.83) 0.30*(0.11, 0.85)
a
Seek comfort from religion ( Never/rarely/sometimes)
Often 0.91 (0.20, 4.09) 0.92 (0.20, 4.10)
Notes: Odds ratios and 95% confidence intervals (in parentheses) are provided; †p< 0.1, *p< 0.05, **p< 0.01, ***p< 0.001 (two tailed tests); a
reference groups.
32 International Journal of Population Studies 2017, Volume 3, Issue 1