
Page 14 - IJPS-4-2
P. 14
Child trafficking in China
Model 2 0.54 (0.14)*** 0.00 (0.01) −0.06 (0.03)* 0.25 (0.15) 1.34 (0.21)*** 0.98 (0.25)*** 1.62 (0.25)*** 1.85 (0.20)*** 1.47 (1.50) 229.20 247.20 257.42 23
Males
Model 1 0.85 (0.10)*** 0.01 (0.01) −0.03 (0.02)* 0.56 (0.11)*** −0.12 (0.95) 425.60 435.60 441.28 23
Origin models
Model 2 0.53 (0.18)** 0.04 (0.02)* −0.11 (0.04)** 0.37 (0.20)+ 1.20 (0.25)*** 1.10 (0.31)*** 0.18 (0.34) 1.95 (0.30)*** −3.39 (2.09) 183.23 201.23 211.83 23
Females
Model 1 0.95 (0.13)*** −0.01 (0.01) 0.01 (0.02) 0.57 (0.14)*** 1.63 (1.37) 263.03 273.03 278.92 23
Model 2 0.66 (0.11)*** 0.07 (0.02)*** −0.02 (0.04) −0.40 (0.34) 2.26 (0.22)*** 1.45 (0.29)*** 2.30 (0.28)*** 0.58 (0.45) −5.80 (2.19)** 125.70 143.70 153.92 23
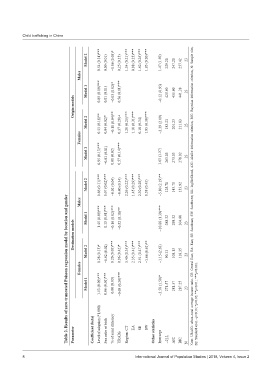
Table 2. Results of zero truncated Poisson regression model by location and gender
Males Note: URAIG: urban–rural average income ratio. CE: Central East; EA: East; SE: Southeast; SW: Southwest; LL: loglikelihood, AIC: Akaike information criterion, BIC: Bayesian information criterion, N: Sample size,
Model 1 1.45 (0.08)*** 0.13 (0.01)*** −0.16 (0.02)*** −0.52 (0.18)** −10.88 (1.39)*** 288.32 298.32 304.00 23
Destination models
Model 2 0.28 (0.13)* −0.02 (0.02) 0.20 (0.05)*** 0.96 (0.42)* 3.40 (0.35)*** 2.35 (0.41)*** 2.51 (0.47)*** −1.66 (0.61)** −1.15 (2.63) 90.13 108.13 118.35 23
Females
Model 1 1.53 (0.09)*** 0.06 (0.01)*** 0.00 (0.03) −0.69 (0.20)*** −3.58 (1.50)* 271.57 281.57 287.25 23 SE: Standard error. +p<0.10; *p<0.05; **p<0.01 ; ***p<0.001.
Parameter Coefficient (beta) Level of adoption (*1,000) Sex ratio at birth % of rural illiteracy URAIG Region: CT EA SE SW Other statistics Intercept −2LL AIC BIC N
8 International Journal of Population Studies | 2018, Volume 4, Issue 2