
Page 34 - IJPS-4-2
P. 34
Living longer in India: Better or worse?
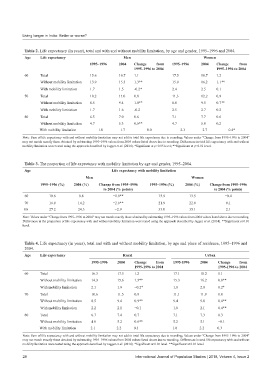
Table 2. Life expectancy (in years), total and with and without mobility limitation, by age and gender, 1995–1996 and 2004.
Age Life expectancy Men Women
1995–1996 2004 Change from 1995–1996 2004 Change from
1995–1996 to 2004 1995–1996 to 2004
60 Total 15.6 16.7 1.1 17.5 18.7 1.2
Without mobility limitation 13.9 15.3 1.3** 15.0 16.2 1.1**
With mobility limitation 1.7 1.5 -0.2* 2.4 2.5 0.1
70 Total 10.2 11.0 0.8 11.3 12.2 0.9
Without mobility limitation 8.5 9.4 1.0** 8.8 9.5 0.7**
With mobility limitation 1.7 1.6 -0.2 2.5 2.7 0.2
80 Total 6.5 7.0 0.6 7.1 7.7 0.6
Without mobility limitation 4.7 5.3 0.6** 4.7 5.0 0.2
With mobility limitation 1.8 1.7 0.0 2.3 2.7 0.4*
Note: Sum of life expectancy with and without mobility limitation may not add to total life expectancy due to rounding; Values under “Change from 1995–1996 to 2004”
may not match exactly those obtained by subtracting 1995–1996 values from 2004 values listed above due to rounding. Differences in total life expectancy with and without
mobility limitation were tested using the approach described by Jagger et al. (2014). *Significant at p<0.05 level; **Significant at p<0.01 level.
Table 3. The proportion of life expectancy with mobility limitation by age and gender, 1995–2004.
Age Life expectancy with mobility limitation
Men Women
1995–1996 (%) 2004 (%) Change from 1995–1996 1995–1996 (%) 2004 (%) Change from 1995–1996
to 2004 (% points) to 2004 (% points)
60 10.6 8.8 −1.9** 13.9 13.5 −0.4
70 16.9 14.2 −2.6** 21.9 22.0 0.1
80 27.2 24.3 −2.9 33.0 35.1 2.1
Note: Values under “Change from 1995–1996 to 2004” may not match exactly those obtained by subtracting 1995–1996 values from 2004 values listed above due to rounding.
Differences in the proportion of life expectancy with and without mobility limitation were tested using the approach described by Jagger et al. (2014). **Significant at 0.01
level.
Table 4. Life expectancy (in years), total and with and without mobility limitation, by age and place of residence, 1995–1996 and
2004.
Age Life expectancy Rural Urban
1995‑1996 2004 Change from 1995‑1996 2004 Change from
1995‑1996 to 2004 1995‑1996 to 2004
60 Total 16.3 17.5 1.2 17.1 18.2 1.1
Without mobility limitation 14.3 15.6 1.3** 15.3 16.2 0.8**
With mobility limitation 2.1 1.9 −0.2* 1.8 2.0 0.2*
70 Total 10.6 11.5 0.9 11.1 11.9 0.8
Without mobility limitation 8.5 9.4 0.9** 9.4 9.8 0.4**
With mobility limitation 2.2 2.1 −0.1 1.8 2.1 0.4**
80 Total 6.7 7.4 0.7 7.1 7.3 0.3
Without mobility limitation 4.6 5.2 0.6** 5.2 5.1 −0.1
With mobility limitation 2.1 2.2 0.1 1.8 2.2 0.3
Note: Sum of life expectancy with and without mobility limitation may not add to total life expectancy due to rounding; Values under “Change from 1995–1996 to 2004”
may not match exactly those obtained by subtracting 1995–1996 values from 2004 values listed above due to rounding. Differences in total life expectancy with and without
mobility limitation were tested using the approach described by Jagger et al. (2014). *Significant at 0.05 level. **Significant at 0.01 level.
28 International Journal of Population Studies | 2018, Volume 4, Issue 2