
Page 35 - IJPS-4-2
P. 35
Sreerupa, et al.
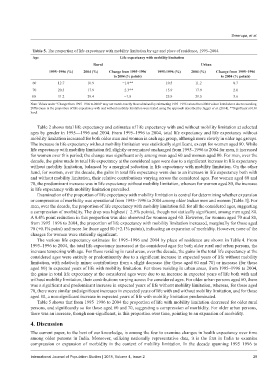
Table 5. The proportion of life expectancy with mobility limitation by age and place of residence, 1995–2004.
Age Life expectancy with mobility limitation
Rural Urban
1995–1996 (%) 2004 (%) Change from 1995–1996 1995‑1996 (%) 2004 (%) Change from 1995–1996
to 2004 (% points) to 2004 (% points)
60 12.7 10.9 −1.8** 10.5 11.2 0.7
70 20.3 17.9 −2.3** 15.9 17.9 2.0
80 31.2 29.4 −1.8 25.9 29.5 3.6
Note: Values under “Change from 1995–1996 to 2004” may not match exactly those obtained by subtracting 1995–1996 values from 2004 values listed above due to rounding.
Differences in the proportion of life expectancy with and without mobility limitation were tested using the approach described by Jagger et al. (2014). **Significant at 0.01
level.
Table 2 shows total life expectancy and estimates of life expectancy with and without mobility limitation at selected
ages by gender in 1995––1996 and 2004. From 1995–1996 to 2004, total life expectancy and life expectancy without
mobility limitation increased for both older men and women in each age group, although more slowly in older age groups.
The increase in life expectancy without mobility limitation was statistically significant, except for women aged 80. While
life expectancy with mobility limitation fell slightly or remained unchanged from 1995–1996 to 2004 for men, it increased
for women over this period; the change was significant only among men aged 60 and women aged 80. For men, over the
decade, the gains made in total life expectancy at the considered ages were due to a significant increase in life expectancy
without mobility limitation, balanced by a marginal reduction in life expectancy with mobility limitation. On the other
hand, for women, over the decade, the gains in total life expectancy were due to an increase in life expectancy both with
and without mobility limitation, their relative contributions varying across the considered ages. For women aged 60 and
70, the predominant increase was in life expectancy without mobility limitation, whereas for women aged 80, the increase
in life expectancy with mobility limitation prevailed.
Examination of the proportion of life expectancy with mobility limitation is central for determining whether expansion
or compression of morbidity was operational from 1995–1996 to 2004 among older Indian men and women [Table 3]. For
men, over the decade, the proportion of life expectancy with mobility limitation fell for all the considered ages, suggesting
a compression of morbidity. The drop was highest (−2.9% points), though not statically significant, among men aged 80.
A 0.4% point reduction in this proportion was also observed for women aged 60. However, for women aged 70 and 80,
from 1995–1996 to 2004, the proportion of life expectancy with mobility limitation increased, marginally for those aged
70 (+0.1% point) and more for those aged 80 (+2.1% points), indicating an expansion of morbidity. However, none of the
changes for women were statically significant.
The various life expectancy estimates for 1995–1996 and 2004 by place of residence are shown in Table 4. From
1995–1996 to 2004, the total life expectancy increased at the considered ages for both older rural and urban persons, the
increase tempering with age. For those residing in rural areas, over the decade, the gains in the total life expectancy at the
considered ages were entirely or predominantly due to a significant increase in expected years of life without mobility
limitation, with relatively minor contributions from a slight decrease (for those aged 60 and 70) or increase (for those
aged 80) in expected years of life with mobility limitation. For those residing in urban areas, from 1995–1996 to 2004,
the gains in total life expectancy at the considered ages were due to an increase in expected years of life both with and
without mobility limitation, their contributions varying across the considered ages. For older urban persons aged 60, there
was a significant and predominant increase in expected years of life without mobility limitation, whereas, for those aged
70, there were similar and significant increases in expected years of life with and without mobility limitation, and for those
aged 80, a non-significant increase in expected years of life with mobility limitation predominated.
Table 5 shows that from 1995–1996 to 2004 the proportion of life with mobility limitation decreased for older rural
persons, and significantly so for those aged 60 and 70, suggesting a compression of morbidity. For older urban persons,
there was an increase, though non-significant, in this proportion over time, pointing to an expansion of morbidity.
4. Discussion
The current paper, to the best of our knowledge, is among the few to examine changes in health expectancy over time
among older persons in India. Moreover, utilizing nationally representative data, it is the first in India to examine
compression or expansion of morbidity in the context of mobility limitation. In the decade spanning 1995–1996 to
International Journal of Population Studies | 2018, Volume 4, Issue 2 29