
Page 12 - IJPS-5-2
P. 12
Worry about eldercare in China
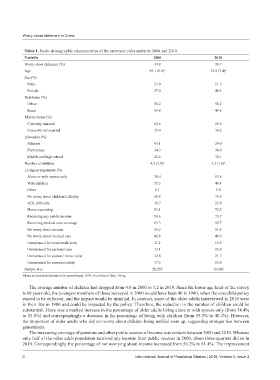
Table 1. Socio-demographic characteristics of the surveyed older adults in 2000 and 2010.
Variable 2000 2010
Worry about eldercare (%) 39.8 38.7
Age 69.1 (6.8) a 72.2 (7.4) a
Sex (%)
Male 53.0 51.7
Female 47.0 48.3
Residence (%)
Urban 50.2 50.2
Rural 49.8 49.8
Marital status (%)
Currently married 62.6 65.8
Currently not married 37.4 34.2
Education (%)
Illiterate 43.1 29.0
Elementary 34.3 38.9
Middle and high school 22.6 32.1
Number of children 4.0 (1.8) a 3.2 (1.6) a
Living arrangements (%)
Alone or with spouse only 38.4 53.8
With children 55.5 40.4
Other 6.1 5.8
No worry about children’s filiality 68.8 75.8
ADL difficulty 18.7 25.8
Home ownership 53.1 72.5
Receiving any public income 50.6 73.7
Receiving medical care coverage 63.3 95.7
No worry about income 56.2 61.4
No worry about medical care 46.8 49.9
Unmet need for housework work 11.2 16.9
Unmet need for personal care 13.1 25.0
Unmet need for doctors’ home visits 12.8 21.7
Unmet need for companionship 17.5 23.0
Sample size 20,255 19,986
a Mean and standard deviation (in parentheses), ADL: Activities of daily living.
The average number of children had dropped from 4.0 in 2000 to 3.2 in 2010. Since the lower age limit of the survey
is 60 years old, the youngest members of those surveyed in 2000 would have been 40 in 1980, when the one-child-policy
started to be enforced, and the impact would be minimal. In contrast, some of the older adults interviewed in 2010 were
in their 30s in 1980 and could be impacted by the policy. Therefore, the reduction in the number of children could be
substantial. There was a marked increase in the percentage of older adults living alone or with spouse only (from 38.4%
to 53.8%) and correspondingly a decrease in the percentage of living with children (from 55.5% to 40.4%). However,
the proportion of older adults who did not worry about children being unfilial went up, suggesting stronger ties between
generations.
The increasing coverage of pensions and other public sources of income was evident between 2000 and 2010. Whereas
only half of the older adult population received any income from public sources in 2000, about three-quarters did so in
2010. Correspondingly, the percentage of not worrying about income increased from 56.2% to 61.4%. The improvement
6 International Journal of Population Studies | 2019, Volume 5, Issue 2