
Page 13 - IJPS-5-2
P. 13
Sun R and Wang H
in receiving medical care coverage was more significant: Increased from 63.3% to 95.7%, though the change in the
percentage of not worrying about medical care was less impressive: From 46.8% to 49.9%.
As shown in Table 1, there was a substantial increase in the unmet needs of all the four types of services included in
this study. Data suggest (not shown) that there were growing demands for all the services in the same decade, even though
there was greater availability of these services except for a slight decrease in doctor’s home visit.
Among the control variables, what is worth noting is that the educational profile of Chinese older adults was improving.
The share of illiterate older adults declined from 43.1% in 2000 to 29.0% in 2010, whereas the shares of those educated
went up. Home ownership within the same decade had grown from 53.1% to 72.5% for the older adult population.
3.2. Regression Analysis of Worry about Eldercare
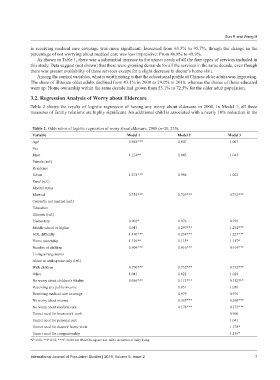
Table 2 shows the results of logistic regression of having any worry about eldercare in 2000. In Model 1, all three
measures of family relations are highly significant. An additional child is associated with a nearly 10% reduction in the
Table 2. Odds ratios of logistic regression of worry about eldercare, 2000 (n=20, 255).
Variable Model 1 Model 2 Model 3
Age 0.988*** 1.007 1.007
Sex
Male 1.124** 1.043 1.043
Female (ref.)
Residence
Urban 1.274*** 0.986 1.023
Rural (ref.)
Marital status
Married 0.754*** 0.729*** 0.732***
Currently not married (ref.)
Education
Illiterate (ref.)
Elementary 0.902* 0.976 0.976
Middle school or higher 0.947 1.297*** 1.292***
ADL difficulty 1.470*** 1.234*** 1.227***
Home ownership 1.129** 1.115* 1.117*
Number of children 0.909*** 0.916*** 0.914***
Living arrangements
Alone or with spouse only (ref.)
With children 0.770*** 0.732*** 0.732***
Other 1.041 1.022 1.024
No worry about children’s filiality 0.056*** 0.112*** 0.112***
Receiving any public income 1.051 1.050
Receiving medical care coverage 0.979 0.976
No worry about income 0.367*** 0.368***
No worry about medical care 0.174*** 0.175***
Unmet need for housework work 0.966
Unmet need for personal care 1.041
Unmet need for doctors’ home visits 1.178*
Unmet need for companionship 1.135*
*P<0.01, **P<0.01, ***P<0.001 for Wald Chi-square test. ADL: Activities of daily living.
International Journal of Population Studies | 2019, Volume 5, Issue 2 7