
Page 37 - IJPS-6-2
P. 37
Wang and Kubanga
daily discrimination (M = 1.75, SD = 0.83). Cognitive functioning scores among participants was about 20 (SD = 4.61),
indicating no cognitive impairment.
3.2. Internet Use Differences by Gender and Age Group
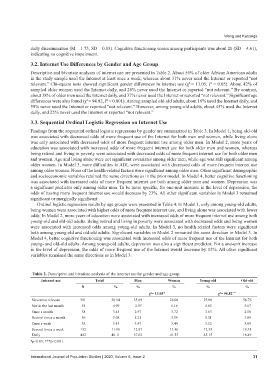
Descriptive and bivariate analyses of internet use are presented in Table 2. About 56% of older African American adults
in the study sample used the Internet at least once a week, whereas about 31% never used the Internet or reported “not
relevant.” Chi-square tests showed significant gender differences in internet use (χ = 13.05, P < 0.05). About 42% of
2
sampled older women used the Internet daily, and 28% never used the Internet or reported “not relevant.” By contrast,
about 38% of older men used the Internet daily, and 37% never used the Internet or reported “not relevant.” Significant age
differences were also found (χ = 94.82, P < 0.001). Among sampled old-old adults, about 16% used the Internet daily, and
2
59% never used the Internet or reported “not relevant.” However, among young-old adults, about 45% used the Internet
daily, and 25% never used the Internet or reported “not relevant.”
3.3. Sequential Ordinal Logistic Regression on Internet Use
Findings from the sequential ordinal logistic regressions by gender are summarized in Table 3. In Model 1, being old-old
was associated with decreased odds of more frequent use of the Internet for both men and women, while living alone
was only associated with decreased odds of more frequent internet use among older men. In Model 2, more years of
education was associated with increased odds of more frequent internet use for both older men and women, whereas
being retired and living in poverty were associated with decreased odds of more frequent internet use for both older men
and women. Age and living alone were not significant covariates among older men, while age was still significant among
older women. In Model 3, more difficulties in ADL were associated with decreased odds of more frequent internet use
among older women. None of the health-related factors were significant among older men. Other significant demographic
and socioeconomic variables retained the same directions as in the prior model. In Model 4, better cognitive functioning
was associated with increased odds of more frequent internet use both among older men and women. Depression was
a significant predictor only among older men. To be more specific, for one-unit increase in the level of depression, the
odds of having more frequent internet use would decrease by 23%. All other significant variables in Model 3 remained
significant or marginally significant
Ordinal logistic regression results by age groups were presented in Table 4. In Model 1, only among young-old adults,
being women were associated with higher odds of more frequent internet use, and living alone was associated with lower
odds. In Model 2, more years of education were associated with increased odds of more frequent internet use among both
young-old and old-old adults. Being retired and living in poverty were associated with decreased odds and being women
were associated with increased odds among young-old adults. In Model 3, no health-related factors were significant
both among young-old and old-old adults. Significant variables in Model 2 remained the same direction in Model 3. In
Model 4, better cognitive functioning was associated with increased odds of more frequent use of the Internet for both
young- and old-old adults. Among young-old adults, depression was also a significant predictor. For a one-unit increase
in the level of depression, the odds of more frequent use of the Internet would decrease by 13%. All other significant
variables remained the same directions as in Model 3.
Table 2. Descriptive and bivariate analysis of the internet use by gender and age group.
Internet use Total Men Women Young-old Old-old
N % % % % %
χ = 13.05* χ = 94.82 ***
2
2
Never/not relevant 341 30.94 35.89 28.08 25.00 58.76
Not in the last month 55 4.99 2.97 6.16 4.85 5.67
Once a month 38 3.45 2.97 3.72 3.63 2.58
Several times a month 56 5.08 4.21 5.59 5.51 3.09
Once a week 38 3.45 3.47 3.44 3.52 3.09
Several times a week 132 11.98 12.87 11.46 12.33 10.31
Daily 442 40.11 37.62 41.55 45.15 16.49
*p<0.05; ***p<0.001.
International Journal of Population Studies | 2020, Volume 6, Issue 2 31