Page 44 - IJPS-6-2
P. 44

Internet use in older African Americans


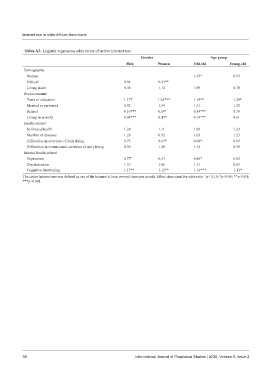
           Table A3. Logistic regression odds ratios of active internet use.
                                                             Gender                        Age group
                                                       Men          Women          Old-old         Young-old
           Demographic
            Women                                                                     1.93*             0.93
            Old-old                                    0.94           0.41**
            Living alone                               0.48           1.12            1.09              0.70
           Socioeconomic
            Years of education                         1.17*        1.24***           1.18**            1.20*
            Married or partnered                       0.92           1.54            1.51              1.32
            Retired                                   0.16***         0.59 +          0.34***           0.76
            Living in poverty                         0.04***         0.47*           0.19***           0.61
           Health-related
            Self-rated health                          1.20           1.11            1.09              1.22
            Number of diseases                         1.26           0.92            1.03              1.23
            Difficulties in activities of daily living    0.75        0.67*           0.68*             0.69
            Difficulties in instrumental activities of daily living    0.99     1.28      1.32          0.99
           Mental Health-related
            Depression                                 0.77 +         0.91            0.86*             0.82
            Discrimination                             1.51 +         1.06            1.31              0.83
            Cognitive functioning                      1.17**         1.12**       1.16***          1.12*
           The active Internet use was defined as use of the Internet at least several times per month. Effect sizes stand for odds ratio.  p< 0.10; *p<0.05; **p<0.01;
                                                                                        +
           ***p<0.001.


           38                                              International Journal of Population Studies | 2020, Volume 6, Issue 2
   39   40   41   42   43   44   45   46