
Page 43 - IJPS-6-2
P. 43
Wang and Kubanga
Appendix
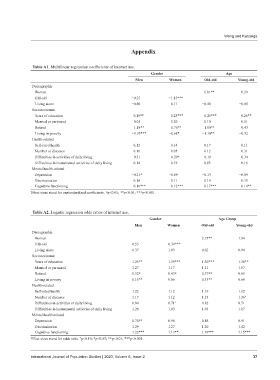
Table A1. Multilinear regression coefficients of internet use.
Gender Age
Men Women Old-old Young-old
Demographic
Women 1.01** 0.29
Old-old −0.25 −1.15***
Living alone −0.80 0.11 −0.48 −0.06
Socioeconomic
Years of education 0.15** 0.23*** 0.26*** 0.26**
Married or partnered −0.05 0.20 0.10 0.51
Retired −1.18** −0.78** −1.00** −0.43
Living in poverty −1.95*** −0.68* −1.10** −0.52
Health-related
Self-rated health 0.12 0.14 0.17 0.11
Number of diseases 0.11 0.05 0.12 0.31
Difficulties in activities of daily living −0.31 −0.29* −0.19 −0.34
Difficulties in instrumental activities of daily living 0.14 0.19 0.03 0.16
Mental health-related
Depression −0.21* −0.09 −0.13 −0.09
Discrimination 0.18 0.11 0.19 0.35
Cognitive functioning 0.16*** 0.12*** 0.17*** 0.14**
Effect sizes stand for unstandardized coefficients. *p<0.05; **p<0.01; ***p<0.001.
Table A2. Logistic regression odds ratios of internet use.
Gender Age Group
Men Women Old-old Young-old
Demographic
Women 2.75** 1.34
Old-old 0.53 0.31***
Living alone 0.37 1.03 0.62 0.94
Socioeconomic
Years of education 1.25** 1.39*** 1.30*** 1.30**
Married or partnered 1.27 1.17 1.11 1.67
Retired 0.32* 0.43* 0.37** 0.65
Living in poverty 0.15** 0.66 0.33** 0.60
Health-related
Self-rated health 1.22 1.12 1.19 1.12
Number of diseases 1.17 1.12 1.13 1.36 +
Difficulties in activities of daily living 0.94 0.71 + 0.82 0.71
Difficulties in instrumental activities of daily living 1.28 1.03 1.03 1.17
Mental health-related
Depression 0.70** 0.96 0.88 0.91
Discrimination 1.29 1.27 1.20 1.42
Cognitive functioning 1.22*** 1.13** 1.19*** 1.15***
Effect sizes stand for odds ratio. p<0.10; *p<0.05; **p<0.01; ***p<0.001.
+
International Journal of Population Studies | 2020, Volume 6, Issue 2 37