
Page 76 - IJPS-7-1
P. 76
Risk factors for cesarean section
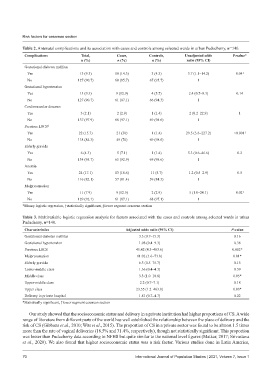
Table 2. Antenatal complications and its association with cases and controls among selected wards in urban Puducherry, n=140.
Complications Total, Cases, Controls, Unadjusted odds P‑value*
n (%) n (%) n (%) ratio (95% CI)
Gestational diabetes mellitus
Yes 13 (9.3) 10 (14.3) 3 (4.3) 3.7 (1.1–14.2) 0.04 †
No 127 (90.7) 60 (85.7) 67 (95.7) 1
Gestational hypertension
Yes 13 (9.3) 9 (12.9) 4 (5.7) 2.4 (0.7–8.3) 0.14
No 127 (90.7) 61 (87.1) 66 (94.3) 1
Cardiovascular diseases
Yes 3 (2.1) 2 (2.9) 1 (1.4) 2 (0.2–22.9) 1
No 137 (97.9) 68 (97.1) 69 (98.6) 1
Previous LSCS ‡
Yes 22 (15.7) 21 (30) 1 (1.4) 29.5 (3.8–227.2) <0.001 †
No 118 (84.3) 49 (70) 69 (98.6) 1
Elderly gravida
Yes 6 (4.3) 5 (7.1) 1 (1.4) 5.3 (0.6–46.6) 0.2
No 134 (95.7) 65 (92.9) 69 (98.6) 1
Anemia
Yes 24 (17.1) 13 (18.6) 11 (5.7) 1.2 (0.5–2.9) 0.8
No 116 (82.1) 57 (81.4) 59 (84.3) 1
Malpresentation
Yes 11 (7.9) 9 (12.9) 2 (2.9) 5 (1.0–24.1) 0.02 †
No 129 (92.1) 61 (87.1) 68 (97.1) 1
*Binary logistic regression, †statistically significant, ‡lower segment cesarean section
Table 3. Multivariable logistic regression analysis for factors associated with the cases and controls among selected wards in urban
Puducherry, n=140.
Characteristics Adjusted odds ratio (95% CI) P‑value
Gestational diabetes mellitus 3.3 (0.7–15.3) 0.16
Gestational hypertension 1.98 (0.4–9.3) 0.38
Previous LSCS 45.42 (4.3–483.6) 0.002*
Malpresentation 11.02 (1.6–73.8) 0.01*
Elderly gravida 6.3 (0.5–75.7) 0.15
Lower-middle class 1.36 (0.4–4.3) 0.59
Middle class 3.3 (1.0–10.8) 0.05*
Upper-middle class 2.2 (0.7–7.1) 0.18
Upper class 23.55 (1.2–463.8) 0.03*
Delivery in private hospital 1.81 (0.7–4.7) 0.22
*Statistically significant, †lower segment cesarean section
Our study showed that the socioeconomic status and delivery in a private institution had higher proportions of CS. A wide
range of literature from different parts of the world has well established the relationship between the place of delivery and the
risk of CS (Gibbons et al., 2010; Witt et al., 2015). The proportion of CS in a private sector was found to be almost 1.5 times
more than the rate of vaginal deliveries (18.5% and 31.4%, respectively), though not statistically significant. This proportion
was lesser than Puducherry data according to NFHS but quite similar to the national level figures (Matkar, 2017; Srivastava
et al., 2020). We also found that higher socioeconomic status was a risk factor. Various studies done in Latin America,
70 International Journal of Population Studies | 2021, Volume 7, Issue 1