
Page 86 - IJPS-7-1
P. 86
Contraception and abortion in Nepalese young women
poorer, middle, richer, and richest), and educational attainment (no education, primary school, secondary school, and
school leaving certificate or higher).
2.3. Analytical strategies
To obtain the profile of young women who were practicing contraception and those who obtained an abortion service
in the past 5 years preceding the survey of 2016, basic statistical techniques such as frequencies, cross tabulations, and
Chi-squire tests were conducted. In this paper, multivariable logistic regression analyses were employed using SPSS v.21
to cross-check the results regarding who practiced contraception who obtained abortion and examined who opted for
safe abortion. In addition, bivariate analyses and Chi-square tests were also conducted using project monitoring data on
women 15 – 24 only. These young women obtained safe abortion services during the stringent lockdown of COVID-19
pandemic period January – June 2020 and during the 1-year period just before the lockdown.
3. Results
3.1. Sample description and odds ratios of use of contraception
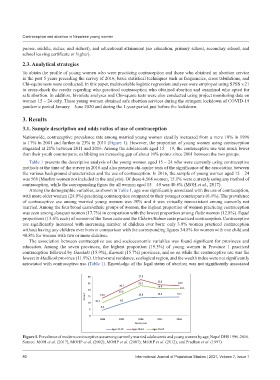
Nationwide, contraceptive prevalence rate among married young women steadily increased from a mere 10% in 1996
to 17% in 2001 and further to 23% in 2011 (Figure 1). However, the proportion of young women using contraception
stagnated at 21% between 2011 and 2016. Among the adolescents aged 15 – 19, the contraceptive use was much lower
than their youth counterparts, exhibiting an increasing gap of about 10% points since 2001 between the two groups.
Table 1 presents the descriptive analysis of the young women aged 15 – 24 who were currently using contraceptive
methods at the time of the survey in 2016 and also presents chi-squire tests of the significance of the association between
the various background characteristics and the use of contraception. In 2016, the sample of young women aged 15 – 24
was 568 (Muslim women not included in the analysis). Of these 4,568 women, 15.1% were currently using any method of
contraception, while the corresponding figure for all women aged 15 – 49 was 40.8% (MOH et al., 2017).
Among the demographic variables, as shown in Table 1, age was significantly associated with the use of contraception,
with more older women (24.9%) practicing contraception compared to their younger counterparts (6.4%). The prevalence
of contraceptive use among married young women was 30% and it was virtually non-existent among currently not
married. Among the four broad caste/ethnic groups of women, the highest proportion of women practicing contraception
was seen among Janajati women (17.7%) in comparison with the lowest proportion among Dalit women (12.8%). Equal
proportions (13.6% each) of women of the Tarai caste and the Chhetri/Bahun caste practiced contraception. Contraceptive
use significantly increased with increasing number of children ever born: only 3.9% women practiced contraception
without having any children ever born in comparison with the corresponding figures 34.8% for women with one child and
40.8% for women with two or more children.
The association between contraceptive use and socioeconomic variables was found significant for provinces and
education. Among the seven provinces, the highest proportion (19.3%) of young women in Province 1 practiced
contraception followed by Gandaki (15.9%), Karnali (15.7%) provinces, and so on while the contraceptive use was the
lowest in Madhesh province (11.9%). Urban-rural residence, ecological region, and the wealth index were not significantly
associated with contraceptive use (Table 1). Knowledge of the legal status of abortion was not significantly associated
Figure 1. Prevalence of modern contraceptive use among currently married adolescents and young women by age, Nepal DHS 1996-2016.
Source: MOH et al. (2017), MOHP et al. (2002); MOHP et al. (2007); MOHP et al. (2012), and Pradhan et al. (1997)
80 International Journal of Population Studies | 2021, Volume 7, Issue 1