Page 91 - IJPS-7-1
P. 91

Karki


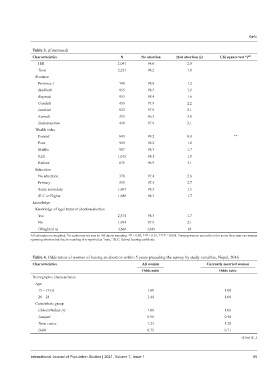
               Table 3. (Continued)
               Characteristics                      N        No abortion    Had abortion (s)   Chi square test “P”
                 Hill                              2,041        98.0             2.0
                 Tarai                             2,221        98.2             1.8
                Province
                 Province 1                         748         98.8             1.2
                 Madhesh                            855         98.5             1.5
                 Bagmati                            953         98.4             1.6
                 Gandaki                            458         97.8             2.2
                 Lumbini                            823         97.9             2.1
                 Karnali                            293         96.2             3.8
                 Sudurpaschim                       438         97.9             2.1
                Wealth index
                 Poorest                            843         99.2             0.8                **
                 Poor                               969         98.2             1.8
                 Middle                             907         98.3             1.7
                 Rich                              1,015        98.1             1.9
                 Richest                            835         96.9             3.1
                Education
                 No education                       378         97.4             2.6
                 Primary                            595         97.3             2.7
                 Some secondary                    1,907        98.5             1.5
                 SLC or Higher                     1,688        98.3             1.7
               Knowledge
                Knowledge of legal status of abortion abortion
                 Yes                               2,574        98.3             1.7
                 No                                1,994        97.9             2.1
                 (Weighted n)                      4,568        4,485            83
              All estimates are weighted. Per cents may not sum to 100 due to rounding. *P ≤ 0.05; **P ≤ 0.01; ***P ≤ 0.001.  Among women currently not in union there was one woman
                                                                             a
              reporting abortion but due to rounding it is reported as “zero;” SLC: School leaving certificate.


               Table 4. Odds ratios of women of having an abortion within 5 years preceding the survey by study variables, Nepal, 2016
               Characteristics                               All women                   Currently married women
                                                             Odds ratio                       Odds ratio
               Demographic characteristics
                Age
                 15 – 19 (r)                                    1.00                             1.00
                 20 – 24                                        1.44                             1.00
                Caste/ethnic group
                 Chhetri/Bahun (r)                              1.00                             1.00
                 Janajati                                       0.91                             0.90
                 Tarai castes                                   1.23                             1.28
                 Dalit                                          0.75                             0.71
                                                                                                        (Cont’d...)


              International Journal of Population Studies | 2021, Volume 7, Issue 1                          85
   86   87   88   89   90   91   92   93   94   95   96