
Page 24 - IJPS-8-1
P. 24
International Journal of
Population Studies Hearing loss, hearing aids, and cognitive function
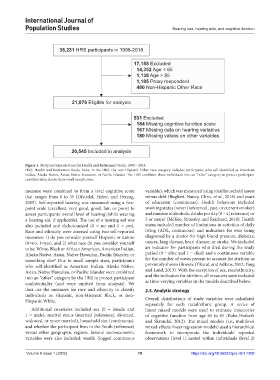
38,231 HRS participants in 1998-2018
17,155 Excluded
14,352 Age < 65
1,138 Age > 85
1,185 Proxy respondent
480 Non-Hispanic Other Race
21,076 Eligible for analysis
531 Excluded
184 Missing cognitive function score
167 Missing data on hearing variables
180 Missing values on other variables
20,545 Included in analysis
Figure 1. Study participants from the Health and Retirement Study, 1998 – 2018.
HRS: Health and Retirement Study. Note: In the HRS, the non-Hispanic Other race category includes participants who self-identified as American
Indian, Alaska Native, Asian, Native Hawaiian, or Pacific Islander. The HRS combines these individuals into an “other” category to protect participant
confidentiality due to their small sample sizes.
measure were combined to form a total cognitive score variable), which was measured using total household assets
that ranges from 0 to 35 (Ofstedal, Fisher, and Herzog, minus debt (Bugliari, Nancy, Chris, et al., 2016) and years
2005). Self-reported hearing was measured using a five- of education (continuous). Health behaviors included
point scale (excellent, very good, good, fair, or poor) to smoking status (never [reference], past, or current smoker)
assess participants’ overall level of hearing (while wearing and number of alcoholic drinks per day (0 – 4 [reference] or
a hearing aid, if applicable). The use of a hearing aid was 5 or more) (McKee, Stransky, and Reichard, 2018). Health
also included and dichotomized (0 = no and 1 = yes). status included number of limitations in activities of daily
Race and ethnicity were assessed using two self-reported living (ADL, continuous) and indicators for ever being
measures: 1) do you consider yourself Hispanic or Latino diagnosed by a doctor for high blood pressure, diabetes,
(0=no, 1=yes), and 2) what race do you consider yourself cancer, lung disease, heart disease, or stroke. We included
to be: White, Black or African American, American Indian, an indicator for participants who died during the study
Alaska Native, Asian, Native Hawaiian, Pacific Islander, or period (0 = alive and 1 = died) and a continuous variable
something else? Due to small sample sizes, participants for the number of waves present to account for attrition as
who self-identified as American Indian, Alaska Native, previously shown (Brown, O’Rand, and Adkins, 2012; Yang
Asian, Native Hawaiian, or Pacific Islander were combined and Land, 2013). With the exception of sex, race/ethnicity,
into an “other” category by the HRS to protect participant and the indicators for attrition, all measures were included
confidentiality (and were omitted from analysis). We as time-varying variables in the models described below.
thus use the measures for race and ethnicity to classify 2.3. Analytic strategy
individuals as Hispanic, non-Hispanic Black, or non-
Hispanic White. Overall distributions of study variables were calculated
separately for each racial/ethnic group. A series of
Additional covariates included sex (0 = female and linear mixed models were used to estimate trajectories
1 = male), marital status (married [reference], divorced, of cognitive function from age 65 to 85 (Rabe-Hesketh
widowed, or never married), household size (continuous), and Skrondal, 2012). The mixed models (i.e., multilevel
and whether the participant lives in the South (reference) mixed-effects linear regression models) used a hierarchical
versus other geographic regions. Several socioeconomic framework to incorporate the individuals’ repeated
variables were also included: wealth (logged continuous observations (level 1) nested within individuals (level 2)
Volume 8 Issue 1 (2022) 18 https://doi.org/10.36922/ijps.v8i1.1308