
Page 37 - IJPS-8-1
P. 37
International Journal of
Population Studies School dropouts and mental health among Indian adolescents
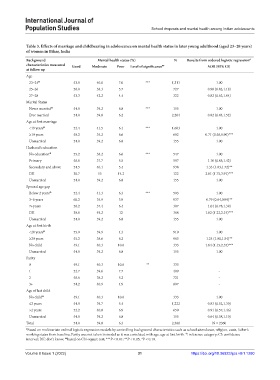
Table 3. Effects of marriage and childbearing in adolescence on mental health status in later young adulthood (aged 23–28 years)
of women in Bihar, India
Background Mental health status (%) N Results from ordered logistic regression #
characteristics measured Good Moderate Poor Level of significance ## AOR (95% CI)
at follow up
Age
23–24 53.0 40.0 7.0 *** 1,311 1.00
25–26 56.0 38.3 5.7 727 0.98 (0.82,1.18)
27–28 53.3 42.2 4.4 322 0.82 (0.63,1.04)
Marital Status
Never married 54.0 39.2 6.8 *** 155 1.00
Ever married 54.0 39.8 6.2 2,204 0.82 (0.44,1.52)
Age at first marriage
<19 years 52.4 41.5 6.1 *** 1,603 1.00
≥19 years 58.2 35.2 6.6 602 0.71 (0.56,0.90)***
Unmarried 54.0 39.2 6.8 155 1.00
Husband’s education
No education 55.2 38.2 6.6 *** 547 1.00
Primary 56.8 37.7 5.5 597 1.10 (0.85,1.42)
Secondary and above 54.5 40.1 5.4 938 1.33 (1.03,1.72)**
DK 30.7 55 14.2 122 2.61 (1.75,3.91)***
Unmarried 54.0 39.2 6.8 155 1.00
Spousal age gap
Below 2 years 52.4 41.3 6.3 *** 593 1.00
3–6 years 60.2 35.9 3.9 937 0.79 (0.64,0.99)**
7+years 56.2 37.4 6.4 307 1.04 (0.78,1.39)
DK 38.8 49.2 12 368 1.62 (1.22,2.15)***
Unmarried 54.0 39.2 6.8 155 1.00
Age at first birth
<20 years 55.9 39.9 4.3 910 1.00
≥20 years 55.2 38.6 6.2 963 1.24 (1.00,1.54)**
No child 49.1 40.3 10.6 333 1.64 (1.15,2.35)***
Unmarried 54.0 39.2 6.8 155 1.00
Parity
0 49.1 40.3 10.6 ** 333
1 52.7 39.6 7.7 409 -
2 56.6 38.2 5.2 721 -
3+ 54.2 40.9 4.9 897 -
Age of last child
No child 49.1 40.3 10.6 333 1.00
≤2 years 54.9 39.7 5.4 1,222 0.83 (0.52,1.30)
>2 years 52.2 40.8 6.9 650 0.91 (0.57,1.46)
Unmarried 54.0 39.2 6.8 155 0.64 (0.38,1.10)
Total 54.0 39.8 6.3 2,360 N = 2360
# Based on multivariate ordinal logistic regression models by controlling background characteristics such as school attendance, religion, caste, father’s
working status from baseline; Parity was not taken in model as it was correlated with age, age at first birth. : reference category; CI: confidence
interval; DK: don’t know; based on Chi-square test; ***P < 0.01; **P < 0.05; *P < 0.10.
##
Volume 8 Issue 1 (2022) 31 https://doi.org/10.36922/ijps.v8i1.1280