
Page 84 - IJPS-8-1
P. 84
International Journal of
Population Studies Urbanization and body weight
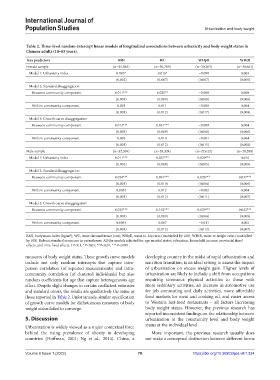
Table 2. Three‑level random‑intercept linear models of longitudinal associations between urbanicity and body weight status in
Chinese adults (18–65 years).
Key predictors BMI WC WHpR WHtR
Female sample (n=35,065) (n=30,709) (n=30,203) (n=30,661)
Model 1: Urbanicity index 0.005* 0.016* −0.008 0.003
(0.002) (0.007) (0.007) (0.005)
Model 2: Standard disaggregation
Between-community component 0.011*** 0.025** −0.008 0.000
(0.003) (0.009) (0.008) (0.006)
Within-community component 0.003 0.011 −0.008 0.004
(0.003) (0.012) (0.017) (0.008)
Model 3: Growth curve disaggregation
Between-community component 0.013*** 0.031*** −0.009 0.004
(0.003) (0.009) (0.008) (0.006)
Within-community component 0.002 0.010 −0.001 0.004
(0.003) (0.012) (0.015) (0.008)
Male sample (n=32,309) (n=28,324) (n=27,622) (n=28,280)
Model 1: Urbanicity index 0.011*** 0.037*** 0.020*** 0.016
(0.002) (0.008) (0.005) (0.005)
Model 2: Standard disaggregation
Between-community component 0.024*** 0.091*** 0.026*** 0.037***
(0.003) (0.010) (0.006) (0.006)
Within-community component 0.005† 0.012 −0.002 0.004
(0.003) (0.012) (0.011) (0.007)
Model 3: Growth curve disaggregation
Between-community component 0.025*** 0.102*** 0.029*** 0.042***
(0.003) (0.009) (0.006) (0.005)
Within-community component 0.005† 0.007 −0.011 0.002
(0.003) (0.012) (0.012) (0.007)
BMI, body mass index (kg/m ); WC, waist circumference (cm); WHpR, waist-to-hip ratio (multiplied by 100); WHtR, waist-to-height ratio (multiplied
2
by 100). Robust standard errors are in parentheses. All the models adjusted for age, marital status, education, household income, provincial fixed
effects, and time fixed effects. †P<0.1; *P<0.05; **P<0.01; ***P<0.001.
measures of body weight status. These growth curve models developing country in the midst of rapid urbanization and
include not only random intercepts that capture intra- nutrition transition, is an ideal setting to assess the impact
person correlation (of repeated measurements) and intra- of urbanization on excess weight gain. Higher levels of
community correlation (of clustered individuals) but also urbanization are likely to include a shift from occupations
random coefficients for age that capture heterogeneous age requiring strenuous physical activities to those with
effect. Despite slight changes in certain coefficient estimates more sedentary activities, an increase in automotive use
and standard errors, the results are qualitatively the same as for job commuting and daily activities, more affordable
those reported in Table 2. Unfortunately, similar specification food markets for meat and cooking oil, and easier access
of growth curve models for dichotomous measures of body to Western fast-food restaurants – all factors increasing
weight status failed to converge. body weight status. However, the previous research has
reported inconsistent findings on the relationship between
5. Discussion urbanization at the community level and body weight
Urbanization is widely viewed as a major contextual force status at the individual level.
behind the rising prevalence of obesity in developing More important, the previous research usually does
countries (Hoffman, 2001; Ng et al., 2014). China, a not make a conceptual distinction between different forms
Volume 8 Issue 1 (2022) 78 https://doi.org/10.36922/ijps.v8i1.334