
Page 12 - IJPS-9-2
P. 12
International Journal of
Population Studies Reproductive transition of Ethiopian youths
15.7%. While 28% of the gender gap in debut to sex at that significantly contributed to the gender gap in the
age 20 (0.079) was explained as a result of differences in distribution of debut to sex, approximately 30%, at both
characteristics, it was a quarter (25.5%) of the gender gap ages 20 and 25 (Table 4).
at age 25 (0.040) that was explained by the difference in Differential effects of predictors were also responsible
the distribution of characteristics. Further, inequality in for the gender gap in the distribution of debut to sex at
the level of educational achievement was the sole factor
age 20. The negative contributions of above-primary
level educational attainment (−0.100) and community
Table 3. Cox and competing risk regression analysis affluence (−0.178) indicate that these factors significantly
Variables and characteristics PMS Marriage Parenthood reduced the prevalence of debut to sex at age 20 for female
SHR SHR HR youths more than otherwise expected. On the other hand,
Birth cohort the discriminatory effect of household wealth (0.063)
contributed to about 22% of the gender gap in the deput
1980–1984 [Ref] 1.00 1.00 1.00 to sex. No significant contribution of individual predictors
1985–1989 2.10*** 0.72*** 1.04 was reported for the coefficient effect at age 25 (Table 4).
Sex The transition to parenthood was also the focus of the
Male [Ref] 1.00 1.00 1.00 gender gap decomposition analysis. The decomposition
Female 0.19*** 3.66*** 3.62*** analysis was made at two points, that is, at ages 20 and
Birth cohort # Sex (Interaction) 25. At the age of 20, there was a 55% of difference in the
1985 – 1989 # Female 3.17*** 0.81** percentage of female and male youths that transitioned to
Note: PMS: Premarital sex; SHR: Sub-hazard ratio; HR: Hazard ratio. parenthood. The gender gap in transition to parenthood
Statistical significance is indicated with **p<0.05; ***p<0.01. at age 25, however, shrunk to 34% from 55% at age 20.
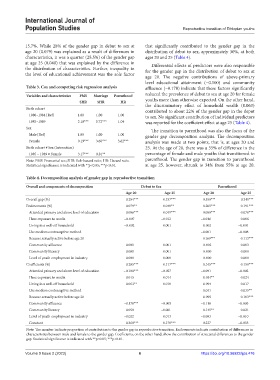
Table 4. Decomposition analysis of gender gap in reproductive transition
Overall and components of decomposition Debut to Sex Parenthood
Age 20 Age 25 Age 20 Age 25
Overall gap (%) 0.284*** 0.157*** 0.550*** 0.341***
Endowments (%) 0.079** 0.040** 0.205*** 0.191***
Attended primary and above level of education 0.086*** 0.049*** 0.050*** 0.078***
Have exposure to media −0.007 −0.012 −0.016 0.006
Living in a well-off household −0.002 0.001 0.002 −0.001
Use modern contraceptive method −0.001 −0.008
Became sexually active before age 20 0.169*** 0.113***
Community affluence 0.001 0.001 0.002 0.003
Community literacy 0.000 0.001 0.000 0.000
Level of youth employment in industry 0.000 0.000 0.000 0.000
Coefficients (%) 0.205*** 0.117*** 0.345*** 0.150***
Attended primary and above level of education −0.100*** −0.027 −0.091 −0.002
Have exposure to media 0.015 0.014 0.034** 0.024
Living in a well-off household 0.063** 0.010 0.094 0.017
Use modern contraceptive method 0.041 0.035**
Became sexually active before age 20 0.095 0.103***
Community affluence −0.178*** −0.063 −0.118 −0.003
Community literacy 0.058 −0.001 0.145** 0.021
Level of youth employment in industry −0.022 0.013 −0.083 −0.010
Constant 0.368*** 0.170*** 0.227 −0.035
Note: The number indicate proportion of contribution to the gender gap in reproductive transition. Endowments indicate contribution of differences in
characteristics between male and female to the gender gap. Coefficients, on the other hand, show the contribution of structural differences to the gender
gap. Statistical significance is indicated with **p<0.05; ***p<0.01.
Volume 9 Issue 2 (2023) 6 https://doi.org/10.36922/ijps.476