
Page 22 - IJPS-9-2
P. 22
International Journal of
Population Studies Dominant drivers of inequalities in child survival
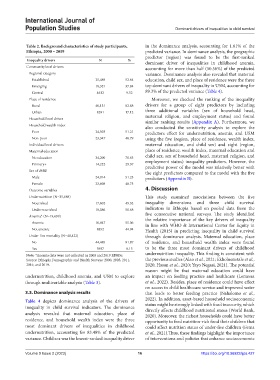
Table 2. Background characteristics of study participants, in the dominance analysis, accounting for 1.61% of the
Ethiopia, 2000 – 2019 predicted variance. In dominance analysis, the geographic
predictor (region) was found to be the first-ranked
Inequality drivers N % dominant driver of inequalities in childhood anemia,
Community level drivers accounting for more than half (50.56%) of the predicted
Regional category variance. Dominance analysis also revealed that maternal
Established 25,489 52.64 education, child sex, and place of residence were the three
Emerging 18,321 37.84 top dominant drivers of inequality in U5M, accounting for
Central 4612 9.52 89.3% of the predicted variance (Table 4).
Place of residence Moreover, we checked the ranking of the inequality
Rural 40,131 82.88 drivers for a group of eight predictors by including
Urban 8291 17.12 three additional variables (sex of household head,
Household level driver maternal religion, and employment status) and found
similar ranking results (Appendix A). Furthermore, we
Household wealth index also conducted the sensitivity analysis to explore the
Poor 24,503 51.21 predictors effect for undernutrition, anemia, and U5M
Non-poor 23,347 48.79 using the five (region, place of residence, wealth index,
Individual level drivers maternal education, and child sex) and eight (region,
Maternal education place of residence, wealth index, maternal education and
No education 34,200 70.63 child sex, sex of household head, maternal religion, and
Primary+ 14,222 29.37 employment status) inequality predictors. However, the
predictive power of the model was relatively better with
Sex of child the eight predictors compared to the model with the five
Male 24,814 51.25 predictors (Appendix B).
Female 23,608 48.75
Outcome variables 4. Discussion
Undernutrition (N=35,688) This study examined associations between the five
Nourished 17,602 49.32 inequality dimensions and three child survival
Undernourished 18,086 50.68 indicators in Ethiopia based on pooled data from the
Anemia* (N=19,699) five consecutive national surveys. The study identified
the relative importance of the key drivers of inequality
Anemic 10,847 55.06 in line with WHO & International Center for Equity in
Not anemic 8852 44.94 Health (2015) in predicting inequality in child survival
Under-five mortality (N=48,422) through dominance analysis. Maternal education, place
No 44,485 91.87 of residence, and household wealth index were found
Yes 3937 8.13 to be the three most dominant drivers of childhood
Note: *Anemia data were not collected in 2000 and 2019 EDHSs. undernutrition inequality. This finding is consistent with
Source: Ethiopia Demographic and Health Surveys: 2000, 2005, 2011, the previous studies (Alao et al., 2021; Ekholuenetale et al.,
2016, and 2019. 2020; Hasan et al., 2020; Yayo Negasi, 2021). The potential
reason might be that maternal education could have
undernutrition, childhood anemia, and U5M to explore an impact on feeding practice and healthcare (Lemessa
through multivariable analysis (Table 3). et al., 2022). Besides, place of residence could have effect
on access to child health-care service and improved water
3.3. Dominance analysis results that leads to better feeding practice (Nahalomo et al.,
Table 4 depicts dominance analysis of the drivers of 2022). In addition, asset-based household socioeconomic
inequality in child survival indicators. The dominance status might be strongly linked with food insecurity, which
directly affects childhood nutritional status (World Bank,
analysis revealed that maternal education, place of 2020). Moreover, the richest households could have better
residence, and household wealth index were the three opportunity to feed nutrition-rich food their children that
most dominant drivers of inequalities in childhood could affect nutrition status of under-five children (Fenta
undernutrition, accounting for 83.48% of the predicted et al., 2021).Thus, these findings highlight the importance
variance. Child sex was the lowest-ranked inequality driver of interventions and policies that enhance socioeconomic
Volume 9 Issue 2 (2023) 16 https://doi.org/10.36922/ijps.427