Page 23 - IJPS-9-2
P. 23

International Journal of
            Population Studies                                              Dominant drivers of inequalities in child survival


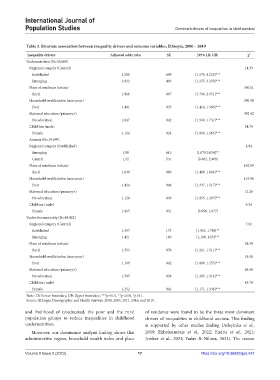
            Table 3. Bivariate association between inequality drivers and outcome variables, Ethiopia, 2000 – 2019
             Inequality drivers                 Adjusted odds ratio     SE           [95% LB, UB]         χ 2
            Undernutrition (N=35,688)
             Regional category (Central)                                                                 14.33
               Established                           2.580              649         [1.576, 4.225]***
               Emerging                              2.022              493         [1.255, 3.259]***
             Place of residence (urban)                                                                  350.61
               Rural                                 1.916              067         [1.790, 2.051]***
             Household wealth index (non-poor)                                                           290.90
               Poor                                  1.491              035         [1.424, 1.560]***
             Maternal education (primary+)                                                               392.42
               No education                          1.647              042         [1.568, 1.731]***
             Child Sex (male)                                                                            24.70
               Female                                1.114              024         [1.068, 1.163]***
             Anemia (N=19,699)
             Regional category (Established)                                                              4.94
               Emerging                              1.98               613          [1.079,3.634]**
               Central                               1.32               531          [0.602, 2.908]
             Place of residence (urban)                                                                  102.09
               Rural                                 1.639              080         [1.489, 1.804]***
             Household wealth index (non-poor)                                                           119.86
               Poor                                  1.424              046         [1.337, 1.517]***
             Maternal education (primary+)                                                               12.26
               No education                          1.128              039         [1.055, 1.207]***
             Child sex (male)                                                                             0.24
               Female                                1.015              031          [0.956, 1.077]
            Under-five mortality (N=48,422)
             Regional category (Central)                                                                  7.92
               Established                           1.357              175         [1.053, 1.748]**
               Emerging                              1.421              180         [1.109, 1.83]***
             Place of residence (urban)                                                                  28.59
               Rural                                 1.353              076         [1.211, 1.511]***
             Household wealth index (non-poor)                                                           18.58
               Poor                                  1.169              042         [1.089, 1.255]***
             Maternal education (primary+)                                                               63.68
               No education                          1.395              058         [1.285, 1.514]***
             Child sex (male)                                                                            43.70
               Female                                1.252              042         [1.171, 1.338]***
            Note: LB: Lower boundary, UB: Upper boundary; ***p<0.01, **p<0.05, *p<0.1.
            Source: Ethiopia Demographic and Health Surveys: 2000, 2005, 2011, 2016, and 2019.

            and livelihood of uneducated, the poor and the rural   of residence were found to be the three most dominant
            population groups to reduce inequalities in childhood   drivers of inequalities in childhood anemia. This finding
            undernutrition.                                    is supported by other studies finding (Adeyinka  et al.,

              Moreover, our dominance analysis finding shows that   2019; Ekholuenetale  et al., 2022; Endris  et al., 2021;
            administrative region, household wealth index and place   Jember  et al., 2021; Yadav & Nilima, 2021). The reason


            Volume 9 Issue 2 (2023)                         17                         https://doi.org/10.36922/ijps.427
   18   19   20   21   22   23   24   25   26   27   28