
Page 36 - IJPS-9-2
P. 36
International Journal of
Population Studies COVID-19 and intersectionality in Brazil
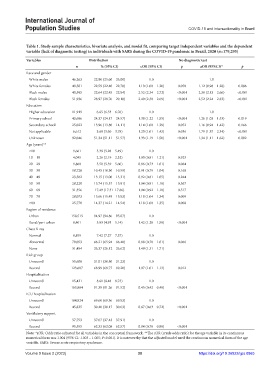
Table 1. Study sample characteristics, bivariate analysis, and model fit, comparing target independent variables and the dependent
variable (lack of diagnostic testing) in individuals with SARS during the COVID‑19 pandemic in Brazil, 2020 (n=179,295)
Variables Distribution No diagnostic test
n % (95% CI) cOR (95% CI) p aOR (95%CI)* p
Race and gender
White males 46,263 22.80 (25.60 – 26.00) 1.0 1.0
White females 40,501 22.59 (22.40 – 22.78) 1.10 (1.00 – 1.20) 0.050 1.12 (0.98 – 1.28) 0.086
Black males 40,595 22.64 (22.45 – 22.84) 2.52 (2.34 – 2.72) <0.001 2.38 (2.13 – 2.66) <0.001
Black females 51,936 28.97 (28.76 – 29.18) 2.49 (2.30 – 2.69) <0.001 2.52 (2.24 – 2.83) <0.001
Education
Higher education 11,919 6.65 (6.53 – 6.76) 1.0 1.0
Primary school 43,696 24.37 (24.17 – 24.57) 1.38 (1.22 – 1.55) <0.001 1.26 (1.03 – 1.53) 0.019
Secondary school 25,022 13.96 (13.80 – 14.11) 1.14 (1.00 – 1.29) 0.052 1.16 (0.94 – 1.42) 0.166
Not applicable 6,612 3.69 (3.60 – 3.78) 1.20 (1.01 – 1.43) 0.036 1.79 (1.37 – 2.34) <0.001
Unknown 92,046 51.34 (51.11 – 51.57) 1.33 (1.19 – 1.50) <0.001 1.34 (1.11 – 1.62) 0.002
Age (years)**
<10 9,661 5.39 (5.28 – 5.49) 1.0
10 – 19 4,045 2.26 (2.19 – 2.32) 1.00 (0.81 – 1.21) 0.923
20 – 29 9,860 5.50 (5.39 – 5.60) 0.86 (0.73 – 1.01) 0.064
30 – 39 18,728 10.45 (10.30 – 10.59) 0.91 (0.79 – 1.04) 0.168
40 – 49 23,582 13.15 (13.00 – 13.31) 0.92 (0.81 – 1.05) 0.244
50 – 59 28,220 15.74 (15.57 – 15.91) 1.04 (0.91 – 1.18) 0.567
60 – 69 31,356 17.49 (17.31–17.66) 1.04 (0.92 – 1.18) 0.517
70 – 79 28,073 15.66 (15.49 – 15.83) 1.18 (1.04 – 1.34) 0.009
≥80 25,770 14.37 (14.21 – 14.54) 1.18 (1.00 – 1.35) 0.008
Region of residence
Urban 158,515 94.97 (94.86 – 95.07) 1.0
Rural/peri-urban 8,401 5.03 (4.93 – 5.14) 1.42 (1.28 – 1.58) <0.001
Chest X-ray
Normal 8,859 7.42 (7.27 – 7.57) 1.0
Abnormal 79,053 66.21 (65.94 – 66.48) 0.88 (0.78 – 1.01) 0.066
None 31,484 26.37 (26.12 – 26.62) 1.49 (1.31 – 1.71)
Risk group
Unrecord 55,608 31.01 (30.80 – 31.23) 1.0
Record 123,687 68.99 (68.77 – 69.20) 1.07 (1.01 – 1.13) 0.012
Hospitalization
Unrecord 15,431 8.61 (8.48 – 8.73) 1.0
Record 163,864 91.39 (91.26 – 91.52) 0.45 (0.42 – 0.48) <0.001
ICU hospitalization
Unrecord 104,924 69.60 (69.36 – 69.83) 1.0
Record 45,835 30.40 (30.17 – 30.63) 0.67 (0.63 – 0.72) <0.001
Ventilatory support
Unrecord 57,753 37.67 (37.43 – 37.91) 1.0
Record 95,555 62.33 (62.08 – 62.57) 0.84 (0.78 – 0.88) <0.001
Note: *aOR: Odds ratio adjusted for all variables in the conceptual framework. **The cOR (crude odds ratio) for the age variable in its continuous
numerical form was 1.004 (95% CI: 1.003 – 1.005; P<0.001). It is noteworthy that the adjusted model used the continuous numerical form of the age
variable. SARS: Severe acute respiratory syndrome.
Volume 9 Issue 2 (2023) 30 https://doi.org/10.36922/ijps.0865