
Page 44 - IJPS-9-3
P. 44
International Journal of
Population Studies The right to lifelong learning
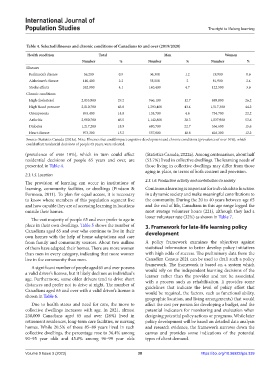
Table 4. Selected illnesses and chronic conditions of Canadians 65 and over (2019/2020)
Health condition Total Men Women
Number % Number % Number %
Illnesses
Parkinson’s disease 56,200 0.9 36,300 1.2 19,900 0.6
Alzheimer’s disease 140,400 2.2 58,500 2 81,900 2.4
Stroke effects 262,900 4.1 140,400 4.7 122,500 3.6
Chronic conditions
High cholesterol 2,855,900 29.2 966,100 12.7 889,800 26.2
High blood pressure 2,810,700 43.8 1,293,400 43.4 1,517,300 44.2
Osteoporosis 893,400 14.0 138,700 4.6 754,700 22.2
Arthritis 2,980,700 46.5 1,142,800 38.3 1,837,900 53.6
Diabetes 1,217,200 18.9 680,700 22.7 536,600 15.6
Heart disease 973,300 15.2 557,000 18.8 416,300 12.2
Source: Statistics Canada (2021a). Note: Illnesses that could impact cognitive development and chronic conditions (prevalence of over 10%), which
could affect residential decisions of people 65 years, were selected.
(prevalence of over 10%), which in turn could affect (Statistics Canada, 2022a). Among centenarians, about half
residential decisions of people 65 years and over, are (53.7%) lived in collective dwellings. The learning needs of
presented in Table 4. those living in collective dwellings may differ from those
aging in place, in terms of both content and provision.
2.3.1.5. Location
The provision of learning can occur in institutions of 2.3.1.6. Productive activity and contribution to society
learning, community facilities, or dwellings (Findson & Continuous learning is important for individuals to function
Formosa, 2011). To plan for equal access, it is necessary in a dynamic society and make meaningful contributions to
to know where members of this population segment live the community. During the 20 to 40 years between age 65
and how capable they are of accessing learning in locations and the end of life, Canadians in this age range logged the
outside their homes. most average volunteer hours (221), although they had a
lower volunteer rate (32%) as shown in Table 7.
The vast majority of people 65 and over prefer to age in
place in their own dwellings. Table 5 shows the number of 3. Framework for late-life learning policy
Canadians aged 65 and over who continue to live in their development
own homes with the help of home adaptations and care
from family and community sources. About two million A policy framework examines the objectives against
of them have adapted their homes. There are more women statistical information to better develop policy initiatives
than men in every category, indicating that more women with high odds of success. The preliminary data from the
live in the community than men. Canadian Census 2021 can be used to draft such a policy
framework. The framework is based on a system which
A significant number of people aged 65 and over possess
a valid driver’s license, but it likely declines as individual’s would rely on the independent learning decisions of the
learner rather than the provider and not be associated
age. Furthermore, some older drivers tend to drive short with a process such as rehabilitation. It provides some
distances and prefer not to drive at night. The number of guidelines that indicate the level of policy effort that
Canadians aged 65 and over with a valid driver’s license is would be required, the factors, such as functional ability,
shown in Table 6. geographic location, and living arrangements) that would
Due to health status and need for care, the move to affect the cost per person for developing a budget, and the
collective dwellings increases with age. In 2021, almost potential indicators for monitoring and evaluation when
238,000 Canadians aged 65 and over (28%) lived in designing potential policy actions or programs. While later
retirement residences, long-term care facilities, or nursing policy development will be based on detailed data analysis
homes. While 20.5% of those 85–89 years lived in such and research evidence, the framework narrows down the
collective dwellings, the percentage rose to 36.4% among canvas and provides some indications of the potential
90–95 year olds and 45.8% among 96–99 year olds types of client demand.
Volume 9 Issue 3 (2023) 38 https://doi.org/10.36922/ijps.339