
Page 78 - IJPS-9-3
P. 78
International Journal of
Population Studies Social contact and coronavirus anxiety
The mean risk perception (RP) for the total sample was 2.46 (mean difference = 0.04, 95% CI: −0.09 – 1.78) was very
(SD = 0.89), while the mean RP for the nursing sample was small (η = 0.0004). Independent sample t-test revealed
2
2.49 (SD = 1.03) and the mean RP for the general public a statistically significant group difference following
sample was 2.45 (SD = 0.83). The mean CA for the total a comparison of the CA scores between the hospital
sample was 0.92 (SD = 1.24), while the mean CA for the nurses and the general public. Specifically, the hospital
nursing sample and for the general public sample was nurses exhibited significantly high level of CA (M = 1.90,
1.90 (SD = 1.63) 0.52 (SD = 0.71), respectively. Detailed SD = 1.63) as compared to the general public (M = 0.52,
descriptive statistics of the samples are given in Table 1. SD = 0.71; t [774] = 16.39, p = 0.001). The magnitude of the
differences in the means of CA (mean difference = 1.38,
Independent sample t-test was conducted to compare 95% CI: 1.22 to 1.55) was very large (η = 0.258).
2
the risk perception scores between the hospital nurses
and the general public. No significant group differences 3.2. Multiple-regression analysis
in the risk perception scores between the hospital nurses After screening the data, we found no issue with
(M = 2.49, SD = 1.03) and the general public (M = 2.45, singularity, multicollinearity, the dependence of errors,
SD = 0.83; t (774) = 0.572, p = 0.568, two-tailed) were normality, linearity, or homoscedasticity as suggested by
observed. The magnitude of the differences in the means Tabachnick et al. (2019). We computed multiple regression
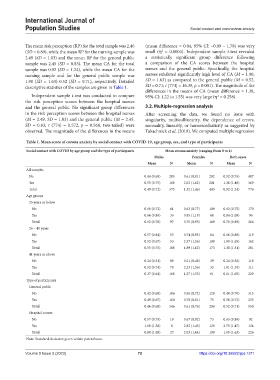
Table 1. Mean score of corona anxiety by social contact with COVID‑19, age group, sex, and type of participants
Social contact with COVID by age group and the type of participants Mean corona anxiety (ranging from 0 to 4)
Males Females Both sexes
Mean N Mean N Mean N
All samples
No 0.44 (0.69) 205 0.61 (0.81) 202 0.52 (0.76) 407
Yes 0.55 (0.75) 168 2.03 (1.62) 201 1.36 (1.49) 369
Total 0.49 (0.72) 373 1.32 (1.46) 403 0.92 (1.24) 776
Age groups
25 years or below
No 0.60 (0.72) 61 0.63 (0.77) 109 0.62 (0.75) 170
Yes 0.66 (0.89) 36 0.95 (1.19) 60 0.84 (1.09) 96
Total 0.62 (0.78) 97 0.75 (0.95) 169 0.70 (0.89) 266
26 – 40 years
No 0.57 (0.84) 55 0.74 (0.93) 64 0.66 (0.89) 119
Yes 0.52 (0.67) 53 2.57 (1.56) 109 1.90 (1.65) 162
Total 0.55 (0.76) 108 1.89 (1.62) 173 1.38 (1.51) 281
41 years or above
No 0.24 (0.51) 89 0.21 (0.48) 29 0.24 (0.50) 118
Yes 0.52 (0.74) 79 2.23 (1.56) 32 1.01 (1.30) 111
Total 0.37 (0.64) 168 1.27 (1.55) 61 0.61 (1.05) 229
Type of participants
General public
No 0.42 (0.68) 186 0.56 (0.72) 129 0.48 (0.70) 315
Yes 0.49 (0.67) 160 0.70 (0.81) 75 0.56 (0.72) 235
Total 0.46 (0.68) 346 0.61 (0.76) 204 0.52 (0.71) 550
Hospital nurses
No 0.57 (0.79) 19 0.67 (0.92) 73 0.65 (0.89) 92
Yes 1.60 (1.38) 8 2.82 (1.45) 126 2.75 (1.47) 134
Total 0.88 (1.08) 27 2.03 (1.64) 199 1.90 (1.63) 226
Note: Standard deviation given within parentheses.
Volume 9 Issue 3 (2023) 72 https://doi.org/10.36922/ijps.1211