
Page 131 - ITPS-7-3
P. 131
INNOSC Theranostics and
Pharmacological Sciences Prognostic values of peripheral blood CD4T transcriptomic signature
Table 2. Stratification of application population by the
gene‑signature clusters
Cluster 1 Cluster 2 P‑value
n (%) 16 (66.7) 8 (33.3) -
Age (mean±SD) 34.25±9.59 41.88±10.09 0.10
Race (%) 0.35
Caucasian 10 (62.5) 7 (87.5)
Other 6 (37.5) 1 (12.5)
CD4% change (mean±SD) 122.66±94.21 32.67±34.31 0.003**
SAR (%) 0.027*
Yes 11 (68.8) 1 (12.5)
No 5 (31.2) 7 (87.5)
Notes: P values were determined by two-sided Fisher’s exact and
Welch’s t-test for discrete and continuous variables, respectively.
*P<0.05, **P<0.01.
Abbreviation: SAR: Strong anti-viral response.
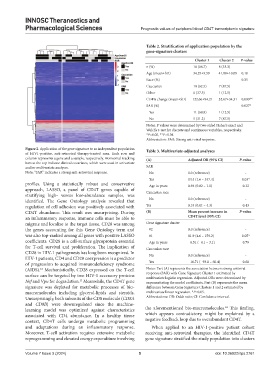
Figure 2. Application of the gene signature to an independent population Table 3. Multivariate‑adjusted analyses
of HIV1-positive, anti-retroviral therapy-treated men. Each row and
column represents a gene and a sample, respectively. Horizontal tracking (A) Adjusted OR (95% CI) P‑value
bars at the top indicate clinical covariates, which were used in univariate
and/or multivariate analyses. SAR
Note: “SAR” indicates a strong anti-retroviral response. No 1.0 (reference) -
Yes 14.4 (1.6 – 337.4) 0.03*
profiles. Using a statistically robust and conservative Age in years 0.94 (0.82 – 1.1) 0.32
approach, LASSO, a panel of CD4T genes capable of Caucasian race
stratifying high- versus low-abundance samples, was
identified. The Gene Ontology analysis revealed that No 1.0 (reference) -
regulation of cell adhesion was positively associated with Yes 0.33 (0.01 – 4.3) 0.43
CD4T abundance. This result was unsurprising. During (B) Mean percent increase in P‑value
an inflammatory response, immune cells must be able to CD4T level (95% CI)
migrate and localize to the target tissue. CD28 was among Gene signature cluster
the genes accounting for this Gene Ontology term and #2 0.0 (reference) -
was also top-ranked among all genes with positive LASSO #1 81.9 (4.6 – 159.2) 0.05*
coefficients. CD28 is a cell-surface glycoprotein essential Age in years −0.51 (−4.1 – 3.1) 0.79
for T-cell survival and proliferation. The implication of Caucasian race
CD28 in HIV-1 pathogenesis has long been recognized. In No 0.0 (reference) -
HIV-1 patients, CD4 and CD28 coexpression is a predictor
of progression to acquired immunodeficiency syndrome Yes −16.71 (−93.8 – 60.4) 0.68
(AIDS). Mechanistically, CD28 expressed on the T-cell Notes: Part (A) represents the association between strong antiviral
12
surface can be targeted by two HIV-1 accessory proteins response (SAR) with Gene Signature Cluster 1 estimated by
multivariate logistic regression. Adjusted ORs were determined by
Nef and Vpu for degradation. Meanwhile, the CD4T gene exponentiating the model coefficients. Part (B) represents the mean
13
signature was depleted for metabolic processes of bio- difference between Gene Signature Clusters 1 and 2 estimated by
macromolecules including glycerol-lipids and steroids. multivariate linear regression. *P<0.05.
Unsurprisingly, both subunits of the CD8 molecule (CD8A Abbreviations: OR: Odds ratio; CI: Confidence interval.
and CD8B) were downregulated since the machine- 14
learning model was optimized against characteristics the aforementioned bio-macromolecules. This finding,
associated with CD4 abundance. In a healthy tissue which appears contradictory, might be explained by a
context, CD4T cells undergo metabolic programming negative feedback loop due to overabundant CD4T.
and adaptations during an inflammatory response. When applied to an HIV-1-positive patient cohort
Moreover, T-cell activation requires extensive metabolic receiving anti-retroviral therapies, the identified CD4T
reprogramming and elevated energy expenditure involving gene signature stratified the study population into clusters
Volume 7 Issue 3 (2024) 5 doi: 10.36922/itps.2761