
Page 130 - ITPS-7-3
P. 130
INNOSC Theranostics and
Pharmacological Sciences Prognostic values of peripheral blood CD4T transcriptomic signature
A b
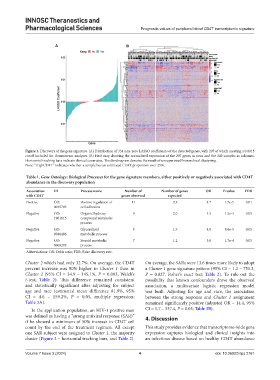
Figure 1. Discovery of the gene signature. (A) Distribution of 334 non-zero LASSO coefficients of the detected genes, with 207 of which meeting a 0.0015
cutoff included for downstream analyses. (B) Heat map showing the normalized expression of the 207 genes as rows and the 340 samples as columns.
Horizontal tracking bars indicate clinical covariates. The dendrogram denotes the result of unsupervised hierarchical clustering.
Note: “HighCD4T” indicates whether a sample has an estimated CD4T proportion over 25%.
Table 1. Gene Ontology: Biological Processes for the gene signature members, either positively or negatively associated with CD4T
abundance in the discovery population
Association ID Process name Number of Number of genes OR P‑value FDR
with CD4T genes observed expected
Positive GO: Positive regulation of 11 2.3 4.7 1.7e-5 0.01
0045785 cell adhesion
Negative GO: Organic hydroxy 9 2.0 4.5 1.5e-4 0.05
1901615 compound metabolic
process
Negative GO: Glycerolipid 9 1.9 4.8 8.6e-5 0.05
0046486 metabolic process
Negative GO: Steroid metabolic 7 1.2 5.8 1.7e-4 0.05
0008202 process
Abbreviations: OR: Odds ratio; FDR: False discovery rate.
Cluster 2 which had only 32.7%. On average, the CD4T On average, the SARs were 13.6 times more likely to adopt
percent increase was 90% higher in Cluster 1 than in a Cluster 1 gene signature pattern (95% CI = 1.2 – 751.3,
Cluster 2 (95% CI = 34.9 – 145.1%, P = 0.003, Welch’s P = 0.027, Fisher’s exact test; Table 2). To rule out the
t-test; Table 2). This difference remained consistent possibility that known confounders drove the observed
and statistically significant after adjusting for subject association, a multivariate logistic regression model
age and race (estimated mean difference 81.9%, 95% was built. Adjusting for age and race, the association
CI = 4.6 – 159.2%, P = 0.05, multiple regression; between the strong response and Cluster 1 assignment
Table 3A). remained significantly positive (adjusted OR = 14.4, 95%
In the application population, an HIV-1 positive man CI = 1.7 – 337.4, P = 0.03; Table 3B).
was defined as having a “strong antiviral response (SAR)” 4. Discussion
if he showed a minimum of 50% increase in CD4T cell
count by the end of the treatment regimen. All except This study provides evidence that transcriptome-wide gene
one SAR subject were assigned to Cluster 1, the majority expression captures biological and clinical insights into
cluster (Figure 2 – horizontal tracking bars, and Table 2). an infectious disease based on healthy CD4T abundance
Volume 7 Issue 3 (2024) 4 doi: 10.36922/itps.2761