
Page 121 - JCAU-6-4
P. 121
Journal of Chinese
Architecture and Urbanism Indoor wind environment in buildings for Qinghai-Tibet plateau of China
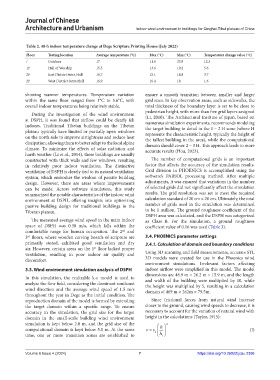
Table 2. 48‑h indoor temperature change at Dege Scripture Printing House (July 2022)
Floor Testing location Average temperature (°C) Max (°C) Min (°C) Temperature change value (°C)
/ Outdoor 17 11.6 23.9 12.3
1F Hall of Worship 15.5 13.6 19.2 5.6
2F East District Sutra Hall 16.7 15.1 18.8 3.7
2F West District Sutra Hall 16.9 16.4 18 1.6
showing warmer temperatures. Temperature variation ensure a smooth transition between smaller and larger
within the same floor ranged from 1°C to 5.6°C, with grid sizes. In key observation areas, such as sidewalks, the
overall indoor temperatures being relatively stable. total thickness of the boundary layer is set to be close to
pedestrian height, with more than five grid layers assigned
During the investigation of the wind environment
at DSPH, it was found that airflow could be clearly felt (Li, 2010). The Architectural Institute of Japan, based on
numerous simulation experiments, recommends modeling
indoors. Traditional Tibetan buildings on the Tibetan the target building in detail in the 1 – 2 H zone (where H
plateau typically have limited or partially open windows represents the characteristic height, typically the height of
on the north side to improve airtightness and reduce heat the tallest building in the area), while the computational
dissipation, allowing them to better adapt to the local alpine domain should cover 2 – 3 H. This approach leads to more
climate. To minimize the effects of solar radiation and accurate results (Hou, 2023).
harsh weather (Li et al., 2014), these buildings are usually
constructed with thick walls and few windows, resulting The number of computational grids is an important
in relatively poor indoor ventilation. The distinctive factor that affects the accuracy of the simulation results.
ventilation of DSPH is closely tied to its natural ventilation Grid division in PHOENICS is accomplished using the
system, which embodies the wisdom of passive building software’s PARSOL processing method. After multiple
design. However, there are areas where improvements adjustments, it was ensured that variations in the number
can be made. Across software simulation, this study of selected grids did not significantly affect the simulation
summarized the notable characteristics of the indoor wind results. The grid resolution was set to meet the required
environment at DSPH, offering insights into optimizing calculation standard of 20 cm × 20 cm. Ultimately, the total
passive building design for traditional buildings in the number of grids used in the simulation was determined
Tibetan plateau. to be 1 million. The ground roughness coefficient of the
DSPH area was calculated, and the DSPH was categorized
The measured average wind speed in the main indoor as Class B. For the simulation, a ground roughness
space of DSPH was 0.30 m/s, which falls within the coefficient value of 0.16 was used (Table 3).
comfortable range for human occupation. The 2 and
nd
3 floors, where wooden carving boards of scripture are 3.4. PHOENICS parameter settings
rd
primarily stored, exhibited good ventilation and dry 3.4.1. Calculation of domain and boundary conditions
air. However, certain areas on the 1 floor lacked proper
st
ventilation, resulting in poor indoor air quality and Using 3D scanning and field measurements, accurate STL
discomfort. 3D models were created for use in the Phoenics wind
environment simulations. Irrelevant factors affecting
3.3. Wind environment simulation analysis of DSPH indoor airflow were simplified in this model. The model
dimensions are 46.9 m × 26.2 m × 15.9 m, and the length
In this simulation, the realizable k-ɛ model is used to and width of the building were multiplied by 10, while
analyze the flow field, considering the dominant southeast the height was multiplied by 5, resulting in a calculation
wind direction and the average wind speed of 1.5 m/s domain of 469 m × 262m × 79.5m.
throughout the year in Dege as the initial condition. The
reproduction domain of the model is formed by extending Since frictional forces from natural wind increase
the target domain within a specific range. To ensure closer to the ground, causing wind speeds to decrease, it is
accuracy in the simulation, the grid size for the target necessary to account for the variation of natural wind with
domain in the small-scale building wind environment height in the calculations (Taylor, 1915):
simulation is kept below 2.0 m, and the grid size of the h α
=
computational domain is kept below 5.0 m. At the same vv 1 (I)
time, one or more transition zones are established to h 1
Volume 6 Issue 4 (2024) 7 https://doi.org/10.36922/jcau.2396