
Page 156 - JCAU-7-3
P. 156
Journal of Chinese
Architecture and Urbanism Cultural tourism and lessons from China
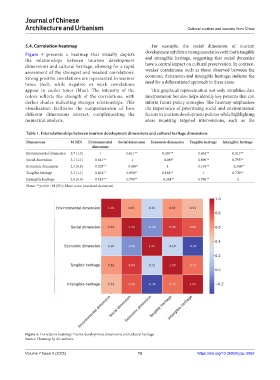
5.4. Correlation heatmap For example, the social dimension of tourism
Figure 4 presents a heatmap that visually depicts development exhibits a strong association with both tangible
the relationships between tourism development and intangible heritage, suggesting that social dynamics
dimensions and cultural heritage, allowing for a rapid have a central impact on cultural preservation. In contrast,
assessment of the strongest and weakest correlations. weaker correlations, such as those observed between the
Strong positive correlations are represented in warmer economic dimension and intangible heritage, indicate the
tones (red), while negative or weak correlations need for a differentiated approach to these areas.
appear in cooler tones (blue). The intensity of the This graphical representation not only simplifies data
colors reflects the strength of the correlations, with interpretation but also helps identify key patterns that can
darker shades indicating stronger relationships. This inform future policy strategies. The heatmap emphasizes
visualization facilitates the comprehension of how the importance of prioritizing social and environmental
different dimensions interact, complementing the factors in tourism development policies while highlighting
numerical analysis. areas requiring targeted interventions, such as the
Table 1. Interrelationships between tourism development dimensions and cultural heritage dimensions
Dimensions M (SD) Environmental Social dimension Economic dimension Tangible heritage Intangible heritage
dimension
Environmental dimension 3.7 (1.2) 1 0.611** 0.205** 0.624** 0.513**
Social dimension 3.1 (1.1) 0.611** 1 −0.089* 0.890** 0.795**
Economic dimension 2.3 (0.8) 0.205** −0.089* 1 0.194** −0.344**
Tangible heritage 3.3 (1.1) 0.624** 0.890** 0.194** 1 0.730**
Intangible heritage 2.8 (0.9) 0.513** 0.795** −0.344** 0.730** 1
Notes: **p<0.01; M (SD): Mean score (standard deviation).
Figure 4. Correlation heatmap: Tourist development dimensions and cultural heritage
Source: Heatmap by the authors.
Volume 7 Issue 3 (2025) 10 https://doi.org/10.36922/jcau.5862