
Page 41 - JCBP-1-1
P. 41
Journal of Clinical and
Basic Psychosomatics Quality of life in patients with atopic dermatitis
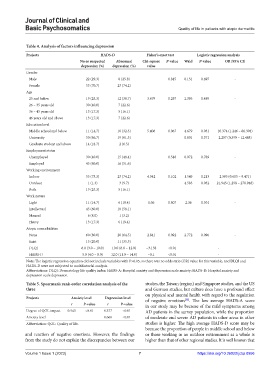
Table 4. Analysis of factors influencing depression
Projects HADS‑D Fisher’s exact test Logistic regression analysis
No or suspected Abnormal Chi‑square P‑value Wald P‑value OR (95% CI)
depression (%) depression (%) value
Gender
Male 22 (29.3) 8 (25.8) 0.815 0.151 0.697 -
Female 53 (70.7) 23 (74.2)
Age
25 and below 19 (25.3) 12 (38.7) 3.679 0.297 2.393 0.495 -
26 – 35 years old 30 (40.0) 7 (22.6)
36 – 45 years old 13 (17.3) 5 (16.1)
46 years old and above 13 (17.3) 7 (22.6)
Education level
Middle school and below 11 (14.7) 10 (32.3) 5.406 0.067 4.679 0.031 10.374 (1.246 – 86.398)
University 50 (66.7) 19 (61.3) 0.801 0.371 2.207 (0.390 – 12.488)
Graduate student and above 14 (18.7) 2 (6.5)
Employment status
Unemployed 30 (40.0) 15 (48.4) 0.518 0.072 0.789 -
Employed 45 (60.0) 16 (51.6)
Working environment
Indoor 55 (73.3) 23 (74.2) 4.342 0.102 1.549 0.213 2.395 (0.605 – 9.471)
Outdoor 1 (1.3) 3 (9.7) 4.583 0.032 21.945 (1.298 – 270.948)
Both 19 (25.3) 5 (16.1)
Work nature
Light 11 (14.7) 6 (19.4) 1.06 0.807 2.36 0.501 -
Intellectual 45 (60.0) 18 (58.1)
Manual 6 (8.0) 1 (3.2)
Heavy 13 (17.3) 6 (19.4)
Atopic comorbidities
None 60 (80.0) 20 (64.5) 2.841 0.092 2.772 0.096 -
Exist 15 (20.0) 11 (35.5)
DLQI 6.0 (3.0 – 10.0) 10.0 (6.0 – 12.0) −3.158 <0.01 -
HADS-D 5.0 (4.0 – 8.0) 12.0 (11.0 – 14.0) −8.1 <0.01 -
Note: The logistic regression equation did not include variables with P>0.05, so there was no odds ratio (OR) value for this variable, and DLQI and
HADS-D were not subjected to multifactorial analysis.
Abbreviations: DLQI: Dermatology life quality index; HADS-A: Hospital anxiety and depression scale anxiety; HADS-D: Hospital anxiety and
depression scale depression.
Table 5. Spearman’s rank‑order correlation analysis of the studies, the Taiwan (region) and Singapore studies, and the US
three and German studies, but culture does have a profound effect
on physical and mental health with regard to the regulation
Projects Anxiety level Depression level of negative emotions . The low average HADS-A score
[33]
r P‑value r P‑value in our study may be because of the mild symptoms among
Degree of QOL impact 0.543 <0.01 0.377 <0.01 AD patients in the survey population, while the proportion
Anxiety level 0.660 <0.01 of moderate and severe AD patients in other areas in other
Abbreviation: QOL: Quality of life. studies is higher. The high average HADS-D score may be
because the proportion of people in middle school and below
and reaction of negative emotions. However, the findings or those working in an outdoor environment as a whole is
from the study do not explain the discrepancies between our higher than that of other regional studies. It is well known that
Volume 1 Issue 1 (2023) 7 https://doi.org/10.36922/jcbp.0956