
Page 48 - JCBP-1-1
P. 48
Journal of Clinical and
Basic Psychosomatics Emotional exhaustion and work–family conflict in physicians
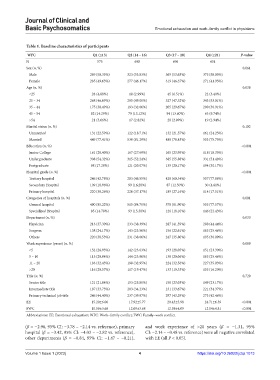
Table 1. Baseline characteristics of participants
WFC Q1 (≤13) Q2 (14 – 16) Q3 (17 – 20) Q4 (≥21) P‑value
N 575 608 696 651
Sex (n, %) 0.061
Male 289 (50.35%) 323 (53.83%) 369 (53.63%) 375 (58.05%)
Female 285 (49.65%) 277 (46.17%) 319 (46.37%) 271 (41.95%)
Age (n, %) 0.038
<25 28 (4.88%) 18 (2.99%) 45 (6.51%) 22 (3.40%)
25 – 34 268 (46.69%) 295 (49.00%) 327 (47.32%) 343 (53.01%)
35 – 44 175 (30.49%) 193 (32.06%) 205 (29.67%) 200 (30.91%)
45 – 54 82 (14.29%) 79 (13.12%) 94 (13.60%) 63 (9.74%)
>54 21 (3.66%) 17 (2.82%) 20 (2.89%) 19 (2.94%)
Marital status (n, %) 0.102
Unmarried 131 (22.59%) 122 (18.71%) 132 (21.57%) 161 (24.25%)
Married 449 (77.41%) 530 (81.29%) 480 (78.43%) 503 (75.75%)
Education (n, %) <0.001
Junior College 161 (28.40%) 167 (27.69%) 165 (23.95%) 118 (18.35%)
Undergraduate 308 (54.32%) 315 (52.24%) 385 (55.88%) 331 (51.48%)
Postgraduate 98 (17.28%) 121 (20.07%) 139 (20.17%) 194 (30.17%)
Hospital grade (n, %) <0.001
Tertiary hospital 246 (42.78%) 283 (46.55%) 420 (60.34%) 507 (77.88%)
Secondary Hospital 109 (18.96%) 99 (16.28%) 87 (12.50%) 30 (4.61%)
Primary hospital 220 (38.26%) 226 (37.17%) 189 (27.16%) 114 (17.51%)
Categories of hospitals (n, %) 0.001
General hospital 490 (85.22%) 515 (84.70%) 570 (81.90%) 505 (77.57%)
Specialized Hospital 85 (14.78%) 93 (15.30%) 126 (18.10%) 146 (22.43%)
Department (n, %) 0.030
Physician 213 (37.30%) 233 (38.39%) 287 (41.59%) 288 (44.44%)
Surgeon 138 (24.17%) 143 (23.56%) 156 (22.61%) 165 (25.46%)
Others 220 (38.53%) 231 (38.06%) 247 (35.80%) 195 (30.09%)
Work experience (years) (n, %) 0.089
<5 152 (26.95%) 142 (23.63%) 193 (28.05%) 151 (23.30%)
5 – 10 113 (20.04%) 144 (23.96%) 138 (20.06%) 165 (25.46%)
11 – 20 183 (32.45%) 198 (32.95%) 224 (32.56%) 227 (35.03%)
>20 116 (20.57%) 117 (19.47%) 133 (19.33%) 105 (16.20%)
Title (n, %) 0.729
Senior title 121 (21.84%) 153 (25.80%) 158 (23.03%) 149 (23.17%)
Intermediate title 187 (33.75%) 203 (34.23%) 231 (33.67%) 221 (34.37%)
Primary technical job title 246 (44.40%) 237 (39.97%) 297 (43.29%) 273 (42.46%)
EE 15.20±6.06 17.92±5.77 20.45±5.98 24.71±6.59 <0.001
FWC 10.59±3.68 12.69±3.68 12.59±4.09 12.04±4.81 <0.001
Abbreviations: EE: Emotional exhaustion; WFC: Work–family conflict; FWC: Family–work conflict.
(β = −2.96, 95% CI: −3.78 – −2.14 vs. reference), primary and work experience of >20 years (β = −1.31, 95%
hospital (β = −3.42, 95% CI: −4.03 – −2.82 vs. reference), CI: −2.14 – −0.48 vs. reference) were all negative correlated
other departments (β = −0.84, 95% CI: −1.47 – −0.21), with EE (all P < 0.05).
Volume 1 Issue 1 (2023) 4 https://doi.org/10.36922/jcbp.1013