
Page 66 - JCBP-2-3
P. 66
Journal of Clinical and
Basic Psychosomatics Depression among medical students and doctors
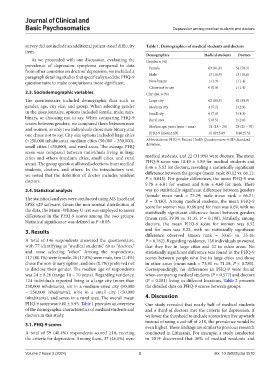
survey did not include an additional patient-rated difficulty Table 1. Demographics of medical students and doctors
item.
Demographics Medical students Doctors
As we proceeded with our discussion, evaluating the Gender, n (%)
prevalence of depression symptoms compared to data Female 63 (81.8) 54 (78.3)
from other countries on doctors’ depression, we included a
paragraph detailing studies that specifically used the PHQ-9 Male 13 (16.9) 13 (18.8)
questionnaire to make comparisons more significant. Non-binary 1 (1.3) 1 (1.4)
Chose not to say 0 (0.0) 1 (1.4)
2.3. Sociodemographic variables City size, n (%)
The questionnaire included demographic data such as Large city 62 (80.5) 62 (89.9)
gender, age, city size, and group. When selecting gender Medium city 4 (5.2) 2 (2.9)
in the questionnaire, options included female, male, non- Small city 6 (7.8) 3 (4.3)
binary, or choosing not to say. When comparing PHQ-9 Rural area 5 (6.5) 2 (2.8)
scores between genders, we compared them between men Median age, years (min – max) 21 (18 – 24) 29 (25 – 70)
and women, as only two individuals chose non-binary, and
one chose not to say. City size options included large cities PHQ-9 (mean±SD) 10.49±5.89 8.46±5.52
(>250,000 inhabitants), medium cities (50,000 – 250,000), Abbreviations: PHQ-9: Patient Health Questionnaire-9; SD: Standard
small cities (<50,000), and rural areas. The average PHQ deviation.
score was compared between individuals living in large
cities and others (medium cities, small cities, and rural medical students, and 22 (31.9%) were doctors. The mean
areas). The group question allowed selections from medical PHQ-9 score was 10.49 ± 5.89 for medical students and
students, doctors, and others. In the introductory text, 8.46 ± 5.52 for doctors, revealing a statistically significant
we noted that the definition of doctor includes resident difference between the groups (mean rank: 80.12 vs. 66.11;
doctors. P = 0.045). For gender differences, the mean PHQ-9 was
9.78 ± 6.01 for women and 8.46 ± 4.60 for men. There
2.4. Statistical analysis was no statistically significant difference between genders
(female mean rank = 73.29; male mean rank = 66.21;
The statistical analyses were conducted using MS Excel and P = 0.430). Among medical students, the mean PHQ-9
SPSS v29 software. Given the non-normal distribution of score for women was 10.86 and for men was 8.69, with no
the data, the Mann–Whitney U test was employed to assess statistically significant difference found between genders
differences in the PHQ-9 scores among the two groups. (mean rank 39.98 vs. 31.35, P = 0.198). Similarly, among
Statistical significance was defined as P <0.05. doctors, the mean PHQ-9 score for women was 8.52
3. Results and for men was 8.23, with no statistically significant
difference observed (mean rank = 33.65 vs. 35.46;
A total of 146 respondents answered the questionnaire, P = 0.762). Regarding residency, 124 individuals answered
with 77 identifying as “medical students,” 69 as “doctors,” that they live in large cities and 22 in other areas. No
and none selecting “other.” Among the respondents, statistically significant difference was found in the PHQ-9
117 (80.1%) were female, 26 (17.8%) were male, two (1.4%) scores between people who live in large cities and those
chose the non-binary option, and one (0.7%) preferred not in other areas (mean rank = 73.91 vs. 71.18; P = 0.780).
to disclose their gender. The median age of respondents Correspondingly, no differences in PHQ-9 were found
was 24 ± 8.26 (range: 18 – 70 years). Regarding residency, when comparing medical students (P = 0.577) and doctors
124 individuals reported living in a large city (more than (P = 0.181) living in different locations. Table 2 presents
250,000 inhabitants), six in a medium-sized city (50,000 the detailed data on PHQ-9 scores between groups.
– 250,000 inhabitants), nine in a small city (<50,000
inhabitants), and seven in a rural area. The overall mean 4. Discussion
PHQ-9 score was 9.60 ± 5.93. Table 1 provides an overview Our study revealed that nearly half of medical students
of the demographic characteristics of medical students and and a third of doctors met the criteria for depression. If
doctors in this study. we lower the threshold to include scores from five upwards
instead of using a cut-off of ≥10, the prevalence would be
3.1. PHQ-9 scores
even higher. These findings are similar to previous research
A total of 59 (40.4%) respondents scored ≥10, meeting conducted in Lithuania. For example, a study conducted
the criteria for depression. Among them, 37 (48.1%) were in 2019 discovered that 36% of medical residents and
Volume 2 Issue 3 (2024) 3 doi: 10.36922/jcbp.3570