
Page 78 - JCBP-2-3
P. 78
Journal of Clinical and
Basic Psychosomatics HD-tDCS on pain in SSD-P
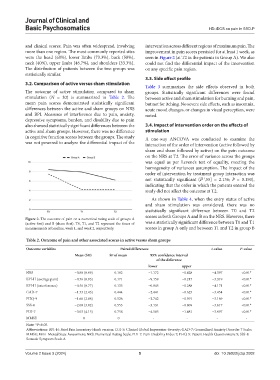
and clinical scores. Pain was often widespread, involving intervention across different regions of maximum pain. The
more than one region. The most commonly reported sites improvement in pain scores persisted for at least 1 week, as
were the head (60%), lower limbs (73.3%), back (50%), seen in Figure 2 (at T2 in the patients in Group A). We also
neck (40%), upper limbs (46.7%), and shoulders (33.3%). could not find the differential impact of the intervention
The distribution of patients between the two groups was on any specific pain region.
statistically similar.
3.3. Side effect profile
3.2. Comparison of active versus sham stimulation
Table 3 summarizes the side effects observed in both
The outcome of active stimulation compared to sham groups. Statistically significant differences were found
stimulation (N = 30) is summarized in Table 2. The between active and sham stimulation for burning and pain,
mean pain scores demonstrated statistically significant but not for itching. No severe side effects, such as insomnia,
differences between the active and sham groups on NRS acute mood changes, or changes in visual perception, were
and BPI. Measures of interference due to pain, anxiety, noted.
depressive symptoms, burden, and disability due to pain
also showed statistically significant differences between the 3.4. Impact of intervention order on the effects of
active and sham groups. However, there was no difference stimulation
in cognitive function scores between the groups. The study A one-way ANCOVA was conducted to examine the
was not powered to analyze the differential impact of the interaction of the order of intervention (active followed by
sham and sham followed by active) on the pain outcome
on the NRS at T2. The error of variance across the groups
was equal as per Levene’s test of equality, meeting the
homogeneity of variances assumption. The impact of the
order of intervention by treatment group interaction was
not statistically significant (F ,55] = 2.136; P = 0.150),
[1
indicating that the order in which the patients entered the
study did not affect the outcome at T2.
As shown in Table 4, when the entry status of active
and sham stimulation was considered, there was no
statistically significant difference between T0 and T2
scores in both Groups A and B on the NRS. However, there
Figure 2. The outcome of pain on a numerical rating scale of groups A
(active first) and B (sham first). T0, T1, and T2 represent the times of was a statistically significant difference between T0 and T1
measurements at baseline, week 1, and week 2, respectively. scores in group A only and between T1 and T2 in group B
Table 2. Outcome of pain and other associated scores in active versus sham groups
Outcome variables Paired differences t‑value P‑value
Mean (SD) SE of mean 95% confidence interval
of the difference
lower upper
NRS −0.80 (0.99) 0.182 −1.172 −0.428 −4.397 <0.01*
BPI-H (average pain) −0.56 (0.93) 0.171 −9.159 −0.217 −3.319 <0.01*
BPI-H (interference) −0.56 (0.77) 0.135 −0.845 −0.288 −4.171 <0.01*
GAD-7 −1.53 (2.43) 0.444 −2.441 −0.625 −3.454 <0.01*
PHQ-9 −1.66 (2.88) 0.526 −2.742 −0.591 −3.169 <0.01*
SSS-8 −2.00 (3.02) 0.553 −3.131 −0.869 −3.617 <0.01*
PDI-7 −3.03 (4.15) 0.758 −4.585 −1.481 −3.997 <0.01*
MMSE 0 0 - - - -
Note: *P<0.05.
Abbreviations: BPI-H: Brief Pain Inventory-Hindi version; CGI-S: Clinical Global Impression-Severity; GAD-7: Generalized Anxiety Disorder 7 Scale;
MMSE: Mini–Mental State Assessment; NRS: Numerical Rating Scale; PDI-7: Pain Disability Index 7; PHQ-9: Patient Health Questionnaire 9; SSS-8:
Somatic Symptom Scale-8.
Volume 2 Issue 3 (2024) 5 doi: 10.36922/jcbp.2002