
Page 52 - JCBP-3-4
P. 52
Journal of Clinical and
Basic Psychosomatics Emotion and blood pressure variability
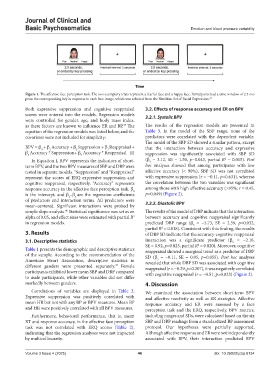
Figure 1. The affective face perception task. The two exemplary trials represent a fearful face and a happy face. Participants had a time window of 2.5 s to
press the corresponding key in response to each face image, which was selected from the NimStim Set of Facial Expression. 44
Both expressive suppression and cognitive reappraisal 3.2. Effects of response accuracy and ER on BPV
scores were entered into the models. Regression models 3.2.1. Systolic BPV
were controlled for gender, age, and body mass index,
as these factors are known to influence ER and BP. The The results of the regression models are presented in
45
equation of the regression models was listed below, and the Table 3. In the model of the SBP range, none of the
covariates were not included for simplicity: predictors were correlated with the dependent variable.
The model of the SBP SD showed a similar pattern, except
BPV = β + β Accuracy + β Suppression + β Reappraisal + that the interaction between accuracy and expressive
1
0
2
3
β Accuracy * Suppression+ β Accuracy * Reappraisal (I) suppression was significantly associated with SBP SD
4
5
2
In Equation I, BPV represents the indicators of short- (β = 3.12, SE = 1.50, p=0.043, partial R = 0.015). Post
4
term BPV, and the two BPV measures of SBP and DBP were hoc analyses showed that among participants with low
tested in separate models. “Suppression” and “Reappraisal” affective accuracy (< 90%), SBP SD was not correlated
represent the scores of ERQ expressive suppression and with expressive suppression (r = −0.11, p=0.631), whereas
cognitive reappraisal, respectively. “Accuracy” represents the correlation between the two variables was significant
response accuracy in the affective face perception task. β among those with high affective accuracy (>95%; r = 0.45,
0
is the intercept, and β –β are the regression coefficients p=0.049) (Figure 2).
5
1
of predictors and interaction terms. All predictors were 3.2.2. Diastolic BPV
mean-centered. Significant interactions were probed by
simple slope analysis. Statistical significance was set as an The results of the model of DBP indicate that the interaction
46
alpha of 0.05, and effect sizes were estimated with partial R between accuracy and cognitive reappraisal significantly
2
in regression models. predicted DBP range (β = −5.73, SE = 2.59, p=0.032,
5
partial R = 0.018). Consistent with this finding, the results
2
3. Results of DBP SD indicate that the accuracy-cognitive reappraisal
3.1. Descriptive statistics interaction was a significant predictor (β = −2.16,
5
SE = 0.92, p=0.023, partial R = 0.020). Moreover, cognitive
2
Table 1 presents the demographic and descriptive statistics reappraisal showed a marginal trend as a predictor of DBP
of the sample. According to the recommendation of the SD (β = −0.11, SE = 0.05, p=0.055). Post hoc analyses
3
American Heart Association, descriptive statistics in revealed that while DBP SD was associated with cognitive
different genders were presented separately. Female reappraisal (r = −0.29, p=0.207), it was negatively correlated
47
participants exhibited lower mean SBP and DBP compared with cognitive reappraisal (r = −0.51, p=0.023) (Figure 2).
to male participants, while other variables did not differ
markedly between genders. 4. Discussion
Correlations of variables are displayed in Table 2. We examined the association between short-term BPV
Expressive suppression was positively correlated with and affective reactivity as well as ER strategies. Affective
mean HR but not with any BP or BPV measures. Mean BP response accuracy and ER were assessed by a face
and HR were positively correlated with all BPV measures. perception task and the ERQ, respectively. BPV metrics,
Furthermore, behavioral performance, that is, mean including ranges and SDs, were calculated based on the six
RT and response accuracy, in the affective face perception SBP and DBP readings from a standardized BP assessment
task was not correlated with ERQ scores (Table 2), protocol. Our hypotheses were partially supported.
indicating that the regression analyses were not impacted Although affective response and ER were not independently
by multicollinearity. associated with BPV, their interaction predicted BPV
Volume 3 Issue 4 (2025) 46 doi: 10.36922/jcbp.8134