
Page 25 - JCTR-10-1
P. 25
Jyothi et al. | Journal of Clinical and Translational Research 2024; 10(1): 18-24 21
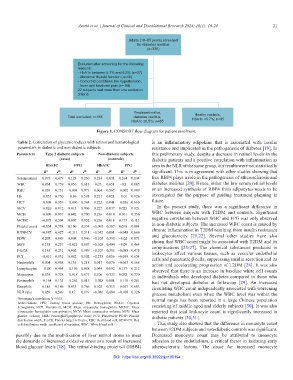
Adults (18–65 years) screened
for diabetes mellitus
(n=335)
Excluded after screening for the following
reasons:
- HbA1c between 5.7% and 6.5% (n=57)
- Abnormal thyroid function (n=46)
- Comorbid conditions like hypertension,
fever and localized pain (n= 84)
22 subjects had more than one exclusion
criteria
Treatment-naïve, Heathy controls,
Total excluded; n=165 diabetes mellitus, HbA1c <5.7%; n=85
HbA1c ≥6.5%; n=85
Figure 1. CONSORT flow diagram for patient enrolment.
Table 2. Correlation of glycemic indices with retinol and hematological is an inflammatory adipokine that is associated with insulin
parameters in diabetic and non-diabetic subjects resistance and implicated in the pathogenesis of diabetes [19]. In
Parameters Type 2 diabetic subjects Non‑diabetic subjects this preliminary study, despite a decrease in retinol levels in the
(cases) (controls) diabetic patients and a positive correlation with inflammation as
HbA1C FPG HbA1C FPG seen in the NLR of the same group, our results were not statistically
R a P b R a P b R a P b R a P b significant. This is in agreement with other studies showing that
Serum retinol 0.078 0.479 0.123 0.260 0.234 0.031 0.164 0.134 free RBP4 plays a role in the pathogenesis of atherosclerosis and
WBC 0.034 0.759 0.056 0.613 0.05 0.651 −0.3 0.005 diabetes mellitus [20]. Hence, either the low serum retinol levels
RBC 0.038 0.731 −0.004 0.971 0.064 0.563 −0.002 0.989 or an increased synthesis of RBP4 from adipocytes needs to be
Hb −0.035 0.750 −0.06 0.588 0.251 0.021 −0.01 0.926 investigated for the purpose of guiding treatment planning in
HCT −0.008 0.939 −0.096 0.384 0.222 0.041 −0.056 0.610 future.
MCV −0.026 0.812 0.013 0.906 0.227 0.037 0.025 0.821 In the present study, there was a significant difference in
MCH −0.009 0.937 0.042 0.700 0.256 0.018 0.101 0.356 WBC between subjects with T2DM and controls. Significant
MCHC −0.073 0.504 0.007 0.952 0.256 0.018 0.173 0.113 negative correlation between WBC and FPG was only observed
Platelet count −0.034 0.758 0.106 0.334 −0.095 0.387 0.016 0.884 in non-diabetic subjects. The increased WBC count is caused by
RDW-CV −0.087 0.427 −0.111 0.311 −0.342 0.001 −0.048 0.666 chronic inflammation in T2DM resulting from insulin resistance
PDW 0.205 0.089 0.008 0.946 −0.105 0.395 −0.02 0.871 and glucotoxicity [21,22]. Several other studies have also
MPV 0.138 0.257 −0.021 0.867 −0.103 0.404 −0.09 0.464 shown that WBC count might be associated with T2DM and its
complications [23-27]. The chemical substances produced in
P-LCR 0.145 0.231 0.002 0.989 −0.107 0.385 −0.088 0.475 leukocytes affect various tissues, such as vascular endothelial
PCT −0.011 0.931 0.082 0.502 −0.233 0.056 −0.059 0.634 cells and pancreatic β cells, suppressing insulin secretion and its
Neutrophils 0.004 0.968 0.135 0.218 0.017 0.876 −0.063 0.568 action and accelerating progression of T2DM [28]. It was also
Lymphocytes −0.08 0.464 −0.186 0.088 0.044 0.692 0.137 0.212 observed that there is an increase in baseline white cell counts
Monocytes 0.038 0.728 −0.018 0.871 0.106 0.333 0.032 0.770 in individuals who developed diabetes compared to those who
Eosinophils −0.164 0.135 −0.262 0.015 −0.028 0.801 −0.118 0.281 had not developed diabetes at follow-up [29]. An increased
Basophils 0.145 0.186 0.033 0.766 0.102 0.353 −0.057 0.603 circulating WBC count independently associated with worsening
NLR ratio 0.059 0.589 0.17 0.119 −0.016 0.884 −0.108 0.326 glucose metabolism even when the WBC level was within the
a Spearman’s correlation. P<0.05. normal range has been reported in a large Chinese population
b
Abbreviations: FPG: Fasting blood glucose; Hb: Hemoglobin; HbA1c: Glycated
hemoglobin; HCT: Hematocrit; MCH: Mean corpuscular hemoglobin; MCHC: Mean consisting of middle-aged and elderly subjects [30]. It was also
corpuscular hemoglobin concentration; MCV: Mean corpuscular volume; MPV: Mean reported that total leukocyte count is significantly increased in
platelet volume; NLR: Neutrophil/lymphocyte ratio; PCT: Plateletcrit; PDW: Platelet diabetic patients [30,31].
distribution width; P-LCR: Platelet larger cell ratio; RBC: Red blood cell; RDW-CV: Red
cell distribution width–coefficient of variation; WBC: White blood cell This study also showed that the difference in monocyte count
between T2DM subjects and non-diabetic controls was significant.
possibly due to the mobilization of liver retinol stores to meet Decreased monocyte count may be attributed to monocyte
the demands of increased oxidative stress as a result of increased adhesion to the endothelium, a critical factor in initiating early
blood glucose levels [18]. The retinol-binding protein-4 (RBP4) atherosclerotic lesions. The cause for increased monocyte
DOI: https://doi.org/10.36922/jctr.00194