
Page 92 - JCTR-10-1
P. 92
88 Tsunou et al. | Journal of Clinical and Translational Research 2024; 10(1): 85-92
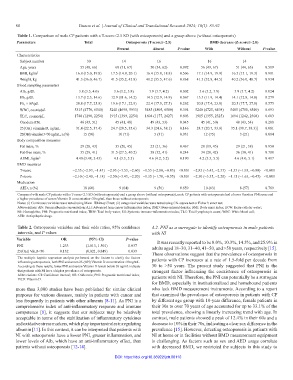
Table 1. Comparison of male CP patients with a T-score<2.5 SD (with osteoporosis) and a group above (without osteoporosis)
Parameters Total Osteoporosis (T‑score≤−2.5) BMD decrease (Z‑score≤−2.0)
Present Absent P‑value With Without P‑value
Characteristics
Subject number 30 14 16 16 14
Age, years 55 (48, 66) 60 (51, 67) 50 (34, 62) 0.092 56 (49, 67) 51 (44, 63) 0.519
BMI, kg/m 2 16.8 (15.0, 19.8) 17.5 (14.9, 20.1) 16.4 (15.0, 18.8) 0.506 17.1 (14.9, 19.9) 16.5 (15.1, 19.3) 0.901
Weight, kg 41.3 (36.0, 46.7) 41.5 (35.2, 45.8) 40.2 (35.5, 47.6) 0.868 41.5 (32.8, 44.5) 40.2 (36.0, 48.7) 0.934
Blood sampling parameters
Alb, g/dL 3.8 (3.5, 4.0) 3.6 (3.2, 3.8) 3.9 (3.7, 4.2) 0.002 3.6 (3.2, 3.9) 3.9 (3.7, 4.2) 0.024
Hb, g/dL 13.7 (12.5, 14.6) 12.9 (11.6, 14.2) 14.5 (12.9, 14.9) 0.067 13.3 (11.9, 14.4) 14.1 (12.8, 14.8) 0.279
Plt, ×10 /μL 20.8 (17.7, 25.8) 19.6 (17.1, 22.9) 22.4 (17.9, 27.5) 0.262 20.8 (17.4, 23.8) 20.5 (17.7, 27.8) 0.575
4
WBC, counts/μL 5315 (4770, 6540) 5240 (4698, 5933) 5485 (4805, 6580) 0.394 5240 (4725, 6498) 5485 (4780, 6540) 0.693
TLC, counts/μL 1748 (1290, 2254) 1915 (1399, 2254) 1694 (1177, 2427) 0.603 1915 (1355, 2325) 1694 (1242, 2308) 0.603
Onodera-PNI 46 (43, 51) 45 (41, 48) 49 (43, 53) 0.045 45 (41, 50) 48 (43, 54) 0.208
25(OH) vitamin D, ng/mL 31.4 (22.5, 37.4) 24.7 (20.5, 35.6) 34.3 (24.6, 38.1) 0.146 24.7 (20.7, 33.9) 35.1 (30.7, 38.3)] 0.081
25(OH) vitamin D<30 ng/mL, n (%) 15 (50) 10 (71) 5 (31) 0.031 12 (75) 3 (21) 0.004
Body composition measures
Fat mass, % 29 (20, 43) 35 (20, 45) 25 (21, 36) 0.467 28 (19, 45) 29 (21, 38) 0.950
Fat-free mass, % 35 (29, 41) 31.5 (27.5, 40.2) 38 (32, 41) 0.244 34 (28, 42) 36 (30, 41) 0.708
ASMI, kg/m 2 4.40 (3.48, 5.43) 4.1 (3.3, 5.5) 4.6 (4.2, 5.2) 0.190 4.2 (3.3, 5.5) 4.6 (4.0, 5.1) 0.417
BMD measures
T-score −2.35 (−2.93, −1.43) −2.95 (−3.53, −2.60) −1.55 (−2.00, −0.83) <0.001 −2.85 (−3.45, −2.53) −1.35 (−1.93, −0.80) <0.001
Z-score −2.10 (−2.40, −1.18) −2.50 (−3.43, −2.20) −1.35 (−1.78, −0.55) <0.001 −2.30 (−3.35, −2.20) −1.15 (−1.63, −0.45) <0.001
Medication
AED, n (%) 18 (60) 9 (64) 9 (56) 0.659 10 (63) 8 (57) 0.769
Compared with male CP patients with a T-score<2.5 SD (with osteoporosis) and a group above (without osteoporosis), male CP patients with osteoporosis had a lower Onodera PNI score and
a higher prevalence of serum Vitamin D concentration<30 ng/mL than those without osteoporosis.
Notes: (i) Continuous variables were tested using Mann–Whitney U test; (ii) categorical variables were tested using Chi-square test or Fisher’s exact test.
Abbreviations: Alb: Serum albumin concentration; ALI: Advanced lung cancer inflammation index; BMD: Bone mineral density; BMI: Body mass index; ECW: Extra-cellular water;
Hb: Hemoglobin; PNI: Prognostic nutritional index; TBW: Total body water; SII: Systemic immune-inflammation index; TLC: Total lymphocyte count; WBC: White blood cell;
AED: Antiepileptic drugs.
Table 2. Osteoporosis variables and their odds ratios, 95% confidence 4.2. PNI as a surrogate to identify osteoporosis in male patients
intervals, and P values with NI
Variable OR (95% Cl) P‑value It was recently reported to be 8.0%, 10.3%, 14.5%, and 25.9% in
PNI 1.233 (1.013, 1.501) 0.037 adults aged 18–30, 31–40, 41–50, and >50 years, respectively [15].
25(OH) Vit.D<30 0.132 (0.021, 0.849) 0.033 These observations suggest that the prevalence of osteoporosis in
The multiple logistic regression analysis performed on the factors to clarify the factors patients with CP increases at a rate of 1.5-fold per decade from
influencing osteoporosis, both PNI and serum 25-(OH) Vitamin D concentration<30 ng/mL.
According to these results, lower PNI and serum Vitamin D levels below 30 ng/mL indicate 30 to >50 years. The present study suggested that PNI is the
that patients with NI have a higher prevalence of osteoporosis. strongest factor influencing the coexistence of osteoporosis in
Abbreviations: CI: Confidence interval; OR: Odds ratio; PNI: Prognostic nutritional index; patients with NI. Therefore, the PNI can potentially be a surrogate
Vit.D: Vitamin D.
for BMD, especially in institutionalized and homebound patients
more than 3,000 studies have been published for similar clinical who lack BMD measurement instruments. According to a report
purposes for various diseases, mainly in patients with cancer and that examined the prevalence of osteoporosis in patients with CP
less frequently in patients with other ailments [8-11]. As PNI is a by different age group with 10-year difference, female patients in
comprehensive index of anti-inflammatory response and immune their 30s to over 70 years of age accounted for up to 33.1% of the
competence [8], it suggests that our subjects may be relatively total prevalence, showing a linearly increasing trend with age. In
acceptable in terms of the stabilization of inflammatory cytokines contrast, male patients showed a peak of 12.4% in their 60s and a
and oxidative stress markers, which play important roles in regulating decrease to 10% in their 70s, indicating a clear sex difference in the
albumin [11]. In this context, it can be interpreted that patients with prevalence [15]. However, detecting osteoporosis in patients with
NI with osteoporosis have a lower PNI, greater inflammation, and NI at home or in facilities without BMD measurement equipment
lower levels of Alb, which have an anti-inflammatory effect, than is challenging. As factors such as sex and AED usage correlate
patients without osteoporosis [12-14]. with decreased BMD, we restricted the subjects in this study to
DOI: https://doi.org/10.36922/jctr.00110