
Page 91 - JCTR-10-1
P. 91
Tsunou et al. | Journal of Clinical and Translational Research 2024; 10(1): 85-92 87
were evaluated using the Mann–Whitney U-test for continuous the osteoporosis group (3.6 g/dL vs. 3.9 g/dL, P = 0.002; 45 vs. 49,
variables and the χ² test or Fisher’s exact test for categorical P = 0.045). Furthermore, the number of patients with 25-OH VD
variables. In method 2, multiple logistic regression analysis was levels of <30 ng/mL was significantly higher in the osteoporosis
performed, and in method 3, the area under the curve (AUC) and group (71% vs. 31%, P = 0.031). These results indicate that,
95% confidence interval (CI) were determined using ROC curve compared with patients without osteoporosis, patients diagnosed
analysis. The AUC with 95% CI was considered significant when with osteoporosis by their T-score had (1) significantly lower Alb
the AUC was 1.0 but not when the AUC was 0.5. The point with and PNI and (2) serum 25-OH VD <30 ng/mL and the number of
the highest sensitivity of (1 - specificity) was defined as the more patients with Vitamin D insufficiency was significantly higher in
effective cutoff value. Statistical significance was defined as the osteoporosis group.
P < 0.05. SPSS version 29 (IBM, Armonk, NY, USA) was used
for all the statistical analyses. 3.2. Lower PNI and Vitamin D insufficiency influence
osteoporosis in patients with NI
3. Results
Multiple logistic regression analysis revealed that PNI and
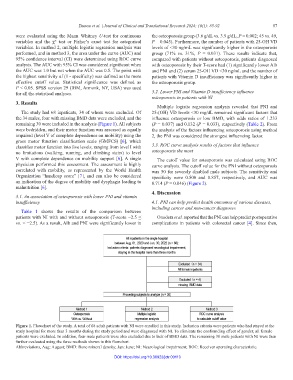
The study had 68 inpatients, 34 of whom were excluded. Of 25-(OH) VD levels <30 mg/dL remained significant factors that
the 34 males, four with missing BMD data were excluded, and the influence osteoporosis or low BMD, with odds ratios of 1.233
remaining 30 were included in the analysis (Figure 1). All subjects (P = 0.037) and 0.132 (P = 0.033), respectively (Table 2). From
were bedridden, and their motor function was assessed as equally the analysis of the factors influencing osteoporosis using method
impaired (level V of complete dependence on mobility) using the 2, the PNI was considered the strongest influencing factor.
gross motor function classification scale (GMFCS) [6], which
classifies motor function into five levels, ranging from level I with 3.3. ROC curve analysis results of factors that influence
no limitations (walking, running, and climbing stairs) to level osteoporosis the most
V with complete dependence on mobility support [6]. A single The cutoff value for osteoporosis was calculated using ROC
physician performed this assessment. The assessment is highly curve analysis. The cutoff value for the PNI without osteoporosis
correlated with mobility, as represented by the World Health was 50 for severely disabled male subjects. The sensitivity and
Organization “handicap score” [7], and can also be considered specificity were 0.500 and 0.857, respectively, and AUC was
an indication of the degree of mobility and dysphagia leading to 0.714 (P = 0.046) (Figure 2).
malnutrition [6].
4. Discussion
3.1. An association of osteoporosis with lower PNI and vitamin
insufficiency 4.1. PNI can help predict health outcomes of various diseases,
including cancer and non-cancer diagnoses
Table 1 shows the results of the comparison between
patients with NI with and without osteoporosis (T-score −2.5 ≤ Onodera et al. reported that the PNI can help predict postoperative
vs. < −2.5). As a result, Alb and PNI were significantly lower in complications in patients with colorectal cancer [4]. Since then,
Figure 1. Flowchart of the study. A total of 68 adult patients with NI were enrolled in this study. Inclusion criteria were patients who had stayed at the
study hospital for more than 3 months during the study period and were diagnosed with NI. To eliminate the confounding effect of gender, all female
patients were excluded. In addition, four male patients were also excluded due to lack of BMD data. The remaining 30 male patients with NI were then
further evaluated using the three methods shown in this flowchart.
Abbreviations, Aug: August; BMD: Bone mineral density; Jun: June; NI: Neurological impairment; ROC: Receiver operating characteristic.
DOI: https://doi.org/10.36922/jctr.00110